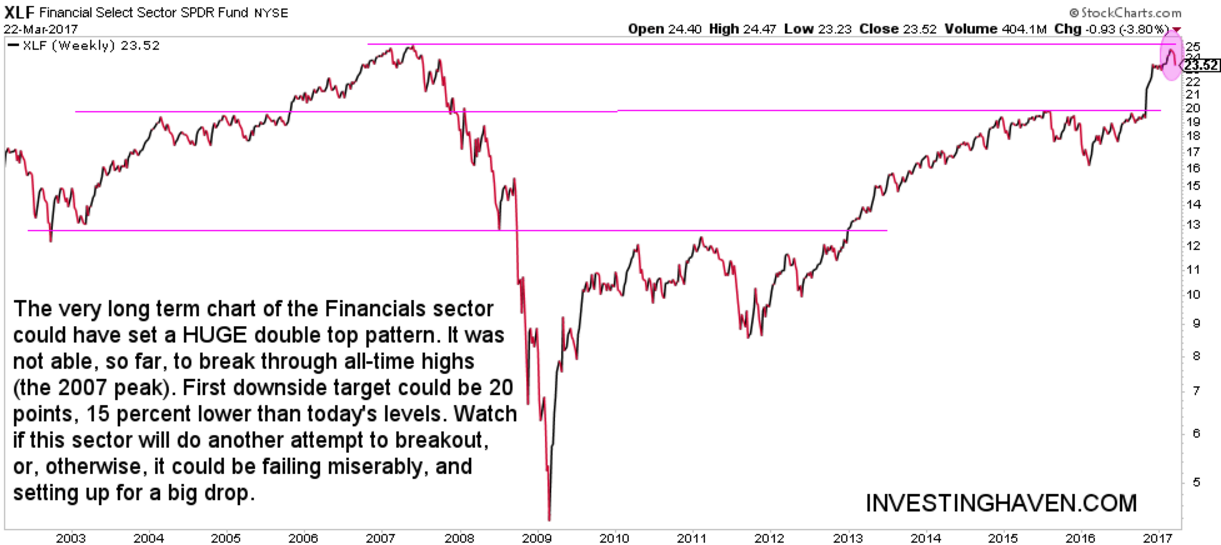
Investors are taking patterns on the very long term charts very serious. If a very obvious and important pattern unfolds on a +10 year chart, it is wise not to ignore it. In the case of the finance sector, we observe a huge double top pattern. When we say huge, we really mean HUGE.
The very long term chart below shows how spectacular this chart setup is. After the 2007 top, financial stocks lost 90 percent of its value in 12 months time. A series of steep rallies followed between 2009 and the start of 2017.
We saw the last rally coming as we wrote last summer Financials Setting Up For Very Strong Rally In 2016?.
However, lately we spotted that the stock market hit all-time highs driven by financials. The point we made in the article is that financials could be breaking out, but they definitely had to get passed their 2007 top. That has not materialized so far, and the failed attempt seems to be resulting in weakness right now.
The financials were leaders since last summer. What happens in a sector that is leading is telling for the stock market as a whole. Stock market bulls do not want to see weakness in financial stocks.
The chart points to a first downside target at 20 points. However, much more downside potential will exist if that level would not hold.
The opposite is true as well: if the former top at 25 points is tested again, and XLF breaks out, it would be extremely bullish. That could only happen if Yields continue to rise.