One of the important principles investors should realize is that markets work, more than anything else, on Pareto’s 80/20 principle. Only 20% of price points or moments in time are relevant; they carry the potential to get 80% of profits. Likewise, less than 20% of investors run away with 80% of profits.
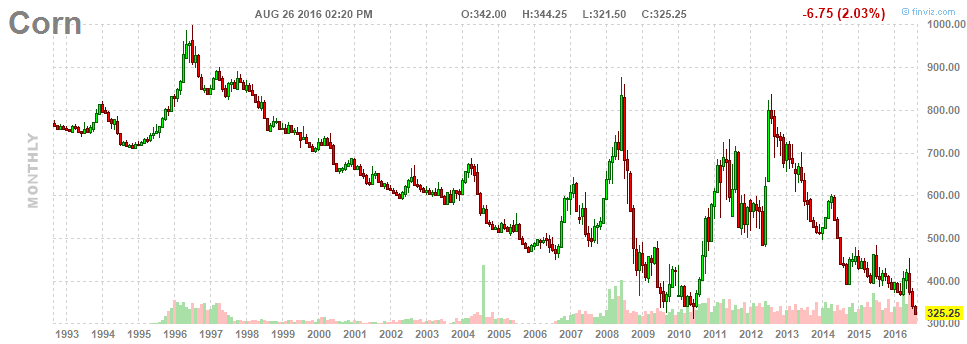
When we apply this principle to charts, it means that only a minority of price points should be watched closely. The corn chart is a textbook example of this. The long term corn chart shows that corn has arrived at multi-decade lows, exactly at the same point as in 2009 and 2010. This is, for now, a double-bottom, and it remains a double-bottom until proven otherwise.
Basically two scenarios can unfold going forward. On the one hand, corn can bottom at this price level, after which a sharp rally will follow. Given its volatile characteristic, such a rally could go very high. On the other hand, if this support level gives away, then corn could go much lower, for the same reasons outlined below.
Admittedly, we don’t have a good view on the fundamentals in the corn market, but simply looking at its long term chart, we could conclude that corn has a structural problem. Whether that is oversupply or declining production costs, we do not really know. Two decades ago, the price of corn was 3 times higher than it is today, so this does not seem a profitable market for running a business.
As investors and traders, we should closely monitor what is happening at this price level. We believe that options trading could be an interesting option depending on how prices evolve in the coming weeks.


