It was another positive day for stock markets, with most indexes gaining around 0.50%. One of the drivers in the stock market are steel stocks. They are in momentum, the question top of mind of investors is whether this will continue.
Steel stocks are represented by the SLX ETF. Almost one third of the holdings of SLX (28% to be very precise) are two steel stocks: Rio Tinto (symbol RIO) and Vale (symbol VALE).
Steel stocks higher – how high can they rise
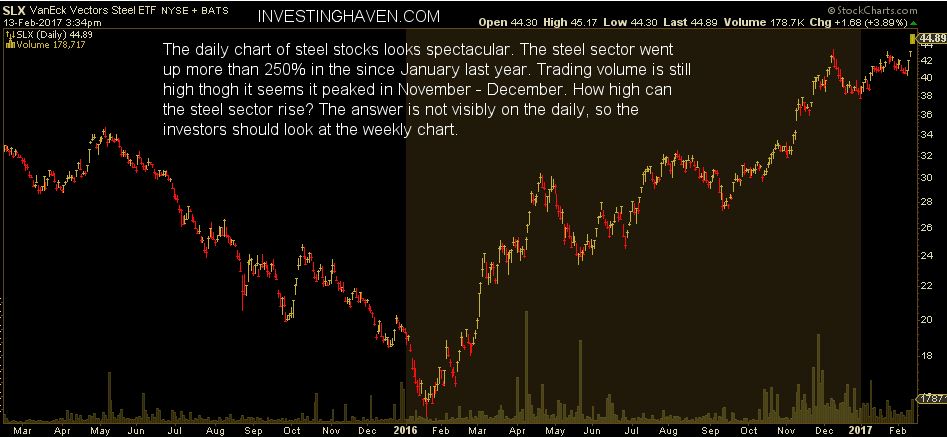
The daily chart of the steel stocks sector, represented by SLX, looks spectacular. SLX went up more than 250% in the last 13 months. Note how trading volume has risen as well, though it seems that volume has peaked in the November – December timeframe.
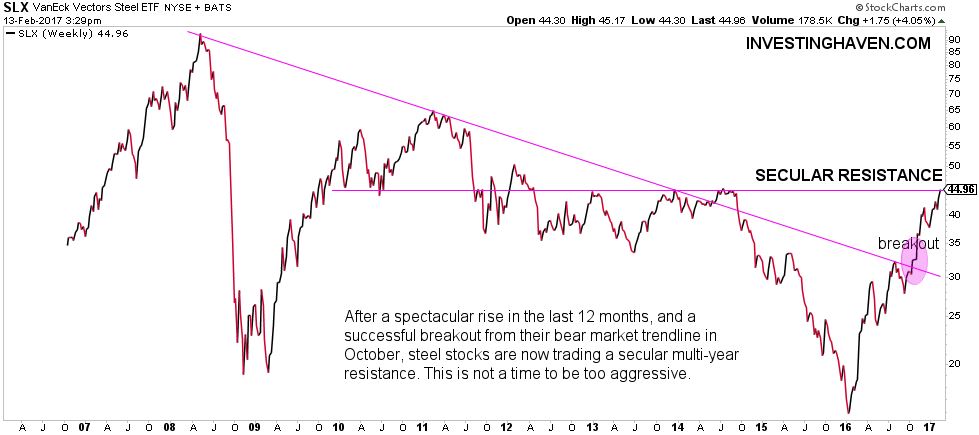
The daily chart (above) does not reveal the upside potential that is left, which, bottom line, is the only thing investors are interested in. Therefore, we should turn our attention to the weekly chart (see below).
The weekly chart of SLX reveals a couple of things. First, the bear market was broken to the upside in October of last year. Second, since then, SLX is trading 40 percent higher, in a matter of 3 months. That is amazing, but also brings up the question how sustainable the rally is. If anything, it is clear that the recent rally is now running into secular resistance. The 45 level in SLX was support in 2010 but became resistance between 2011 and 2015. After a sharp rally, it makes sense that SLX will take a pause at this price point.
InvestingHaven’s research team believes this is not the time to be aggressive in steel stocks. Though demand from China can definitely push steel prices higher, and, consequently, also steel stocks, it just seems that this rally has already gone very far.


