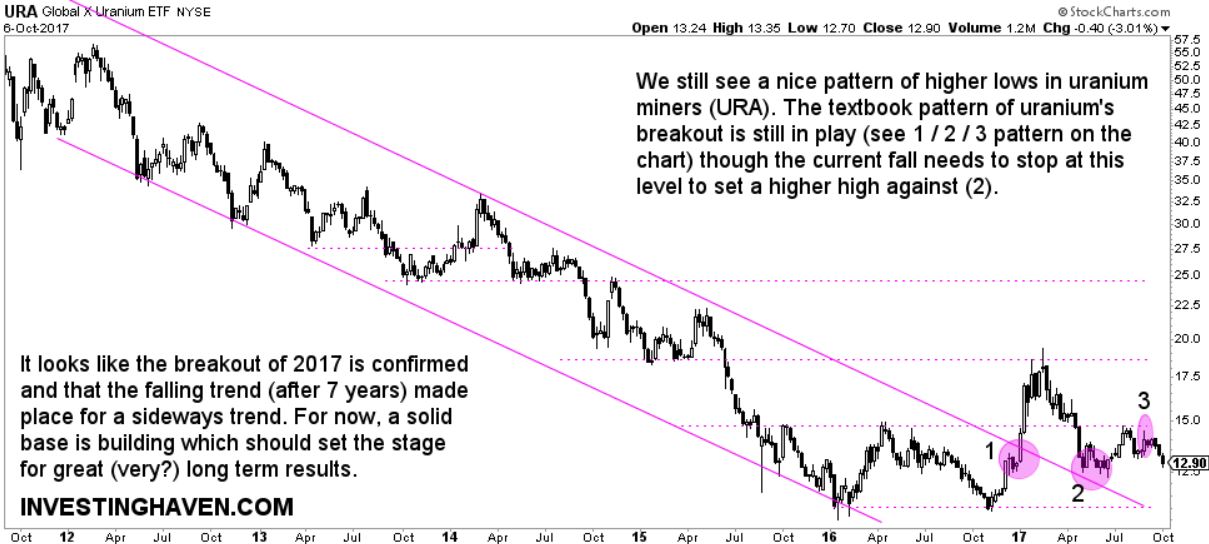
Readers asked us this week what to make out of recent weakness in the uranium market. Rightfully so as URA ETF (representing uranium miners) fell 3 percent for the week and 14 percent since it peaked in September.
Below is the URA ETF (URA) weekly chart. It shows in a very clear way that a couple of things are happening in this market:
- The downtrend is over.
- The falling channel got broken to the upside in December last year.
- The breakout got confirmed right before summer 2017.
- Since this summer uranium miners look weak but have not broken any support (yet).
Our interpretation of this market? This is a typical consolidation which tests patience of investors. A consolidation is nerve-racking. That is the condition for a new bull market at a later point in the future. The great about what we see is that it is becoming a solid base, at least so far. URA ETF should not fall below 12 points and certainly not below 10 in order to remain in its newly formed consolidation pattern.
It seems that this market needs the time it desires. The million dollar and unanswered question is: how long will this consolidation pattern take? Will it be another 1 or 6 months? Will it be another 1 or 3 years? Nobody knows.
When it comes to individual stocks we see that 2017 is creating a similar consolidation pattern. UEC, for instance, a sector leader, has this consolidation on its weekly chart.
Cameco (CCJ), who crashed this week, has a similar consolidation setup on its weekly (though it looks weaker than UEC and URA ETF). Its very long term chart suggests that it is close to support but that there is no breakdown (yet).
For now, it looks like 2017 is building a strong consolidation pattern which is long term bullish. Support must hold though.


