According to our analysis, this current week will be decisive as price action during the week will determine whether silver will resolve higher this summer or whether the market will offer one last buy the dip opportunity.
Related – When Exactly Will The Price Of Silver Start A Rally To $50?
While we tend to end up forecasting in most of our articles, we will not do so in this article (please read our 2024 silver forecast). Rather, we’ll read the timeline and the price axis, both combined, and overlay it with some leading indicator information.
Silver – Timeline readings
As said in the past, 99% of analysts are focused on one, and only one axis on the chart (which is price). Our thesis is that those analysts miss 50% of the information provided by the chart.
The silver chart is no exception – we leverage timeline and price information, both.
When we focus on the timeline of the silver chart, we retrieve some important insights:
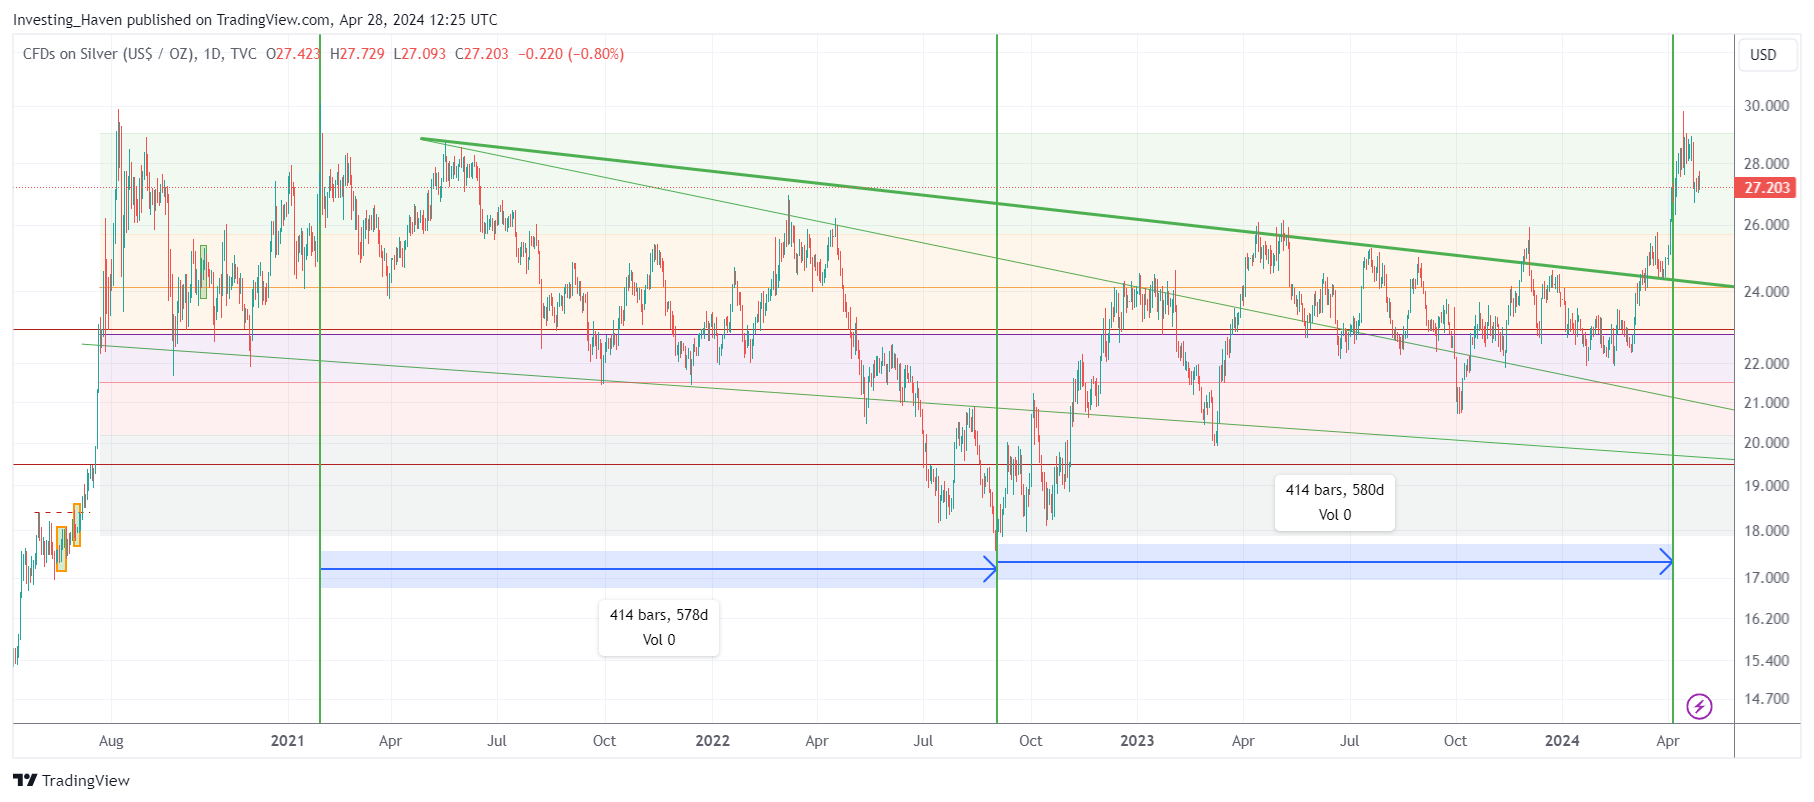
- A giant reversal is complete since early April.
- This reversal connects the highs of Feb 2021 with the lows of Sept 2022 in a period of 414 days. Furthermore, after exactly 414 days, the same price point was touched.
- From highs to lows back to highs in twice 414 days. This symmetric setup is important as it suggests a new structure started in April of 2024.
The timeline of the next chart says it all.

Silver – Price analysis
Now, the beauty of time + price analysis is that you works like a puzzle. You can retrieve high confidence level insights from either time or price or both. You know what is obvious, you know what is unknown, you can identify exact conditions to understand outcomes.
When we apply the above (general) rule to the silver timeline readings, we see two outcomes for the silver price:
- Either a multi-month reversal, maybe 50% of 414 days, to create a handle and end up with a cup and handle situation.
- Or a bullish ABCD pattern which will push silver to our longstanding first bullish target of $34.70 by summer of 2024.
Here is the important part – the market will have to decide, the coming days, which path it will choose.
Leading Indicators
If anything, leading indicators help us tremendously understand which path is most likely.
In our latest gold & silver market report we analyzed silver’s leading indicators. The conclusion was clear – you may want to read the detailed insights we shared with premium members.
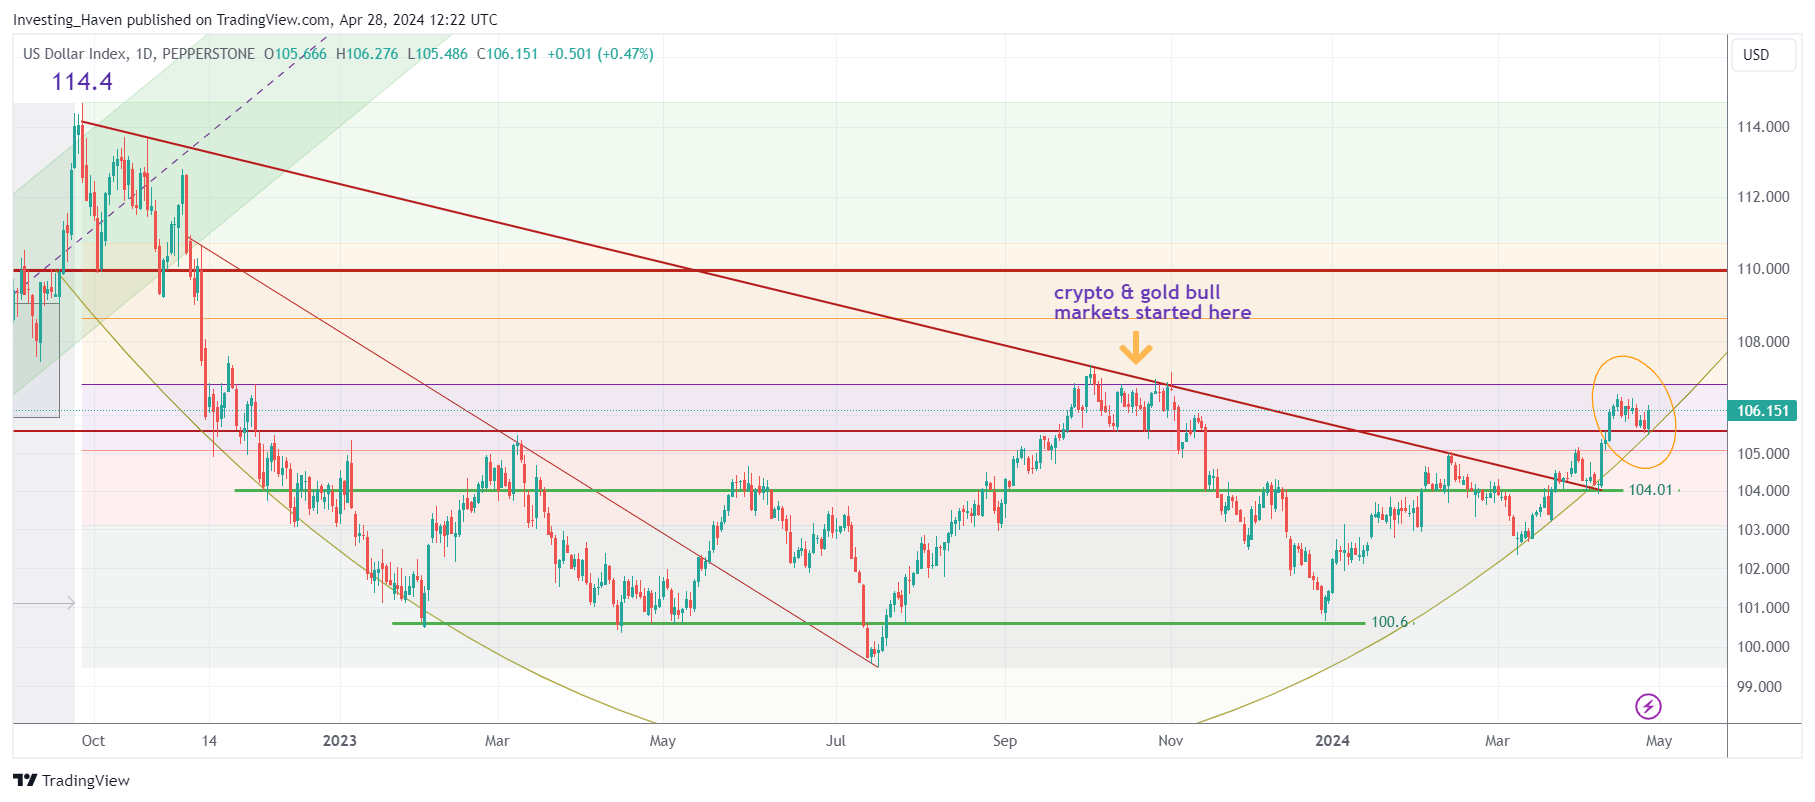
While we analyzed many leading indicators, the one that stands out and is very easy to track is the USD. The bullish reversal shown on its chart says it all – a move higher in the coming week(s) will lead to a breakout. This, if materialized, will affect precious metals.

Our viewpoint – any price decline in precious metals will offer an amazing buy the dip opportunity later in 2024! We explained, in detail, the conditions to understand if/when a buy the dip opportunity would occur!
Those who missed the nice uptrend in gold & silver in recent months may have one more (maybe last) time to join the bull run. We strongly recommend to follow our premium gold & silver market reports to receive timely guidance on gold & silver price analysis, but also timeline and leading indicator analysis.
Premium gold & silver market reports >>


