In particular, silver might rise to the area $88 to $100 /oz between mid-2027 and mid-2028.
Silver requires either exceptional market conditions like rising inflation or an extreme shortage in order to rise to $100 /oz which might not be its endpoint once it clears ATH at $50.
In this article, we analyze the long term silver charts in order to understand if a silver rise to $100 an Ounce is a feasible path. Particularly, we look at:
- Long term silver chart dynamics.
- Silver charts factoring in CPI impact.
- Potential catalysts to trigger a silver rally to $100.
- Intermarket correlations.
February 18th – Silver charts and commentary are updated today.
Note – We don’t see any value in silver news as evidenced by the pointless headlines.
Silver price set to rise
Our latest silver prediction is based on historical data, market correlations and chart readings. It’s a data driven way to analyze precious metals.
Note – the analyst team at InvestingHaven.com is unbiased. No silver perma-bulls over here.
An important quote from the article mentioned above:
To be honest, our viewpoint is that all conditions are in place for silver to run to its two higher targets: $34 and $50. The question why silver is not trading at those levels is a good question to ask. The ‘silver manipulation’ theme comes up as an answer. Concurrently, the other answer that comes up is ‘opportunity’: if an asset is undervalued, it usually is a matter of time until a rebalancing act occurs.
With that said, we will take a big picture viewpoint in this article. While the points outlined above are relevant in 2024 and 2025, we think in terms of “how high can silver go this decade” in this article.
Remember, a silver price rise to to $100 an Ounce is not an idea that will materialize in 2025. If silver were to rise to $100, it would mark a secular top which is likely to happen late(r) this decade.
Silver price to $100: summary
We firmly believe that silver will rally to $50 in the not too distant future. All data points outlined in this article and other articles published in our silver section are confirming this viewpoint.
The recent surge in CPI is not reflected in the silver price. A delayed upward move in silver in USD terms needs to bring the historical CPI/Silver correlation in synch.
However, a silver price rise to $100 requires extreme conditions. We mention 3 such conditions in this article:
- an extreme silver shortage;
- a series of rate cuts by policy makers;
- elevated (monetary) inflation.
A combination of at least 2 out of the 3 conditions will enable silver to move past $100. For instance, an extreme silver shortage and rate cuts can enable a big spike in silver, and so can elevated monetary inflation combined with a silver shortage.
The impact of the growing silver shortage
The current silver shortage may become extreme, in which case silver will not only move to $50 but also exceed it.
January 1st – These valuable insights on the silver shortage by the CEO of Dolly Varden Silver:
- There is about 0.25 billion ounces of demand that cannot be met through new mining supply.
- Silver is largely produced as a by-product rather than as a primary target.
- Only 28% of silver production comes from primary silver mines, with the rest being a by-product.
- challenges faced by silver mining in key producing countries such as Mexico, Peru, and Chile.
- The global silver market is facing a 1 billion ounce supply gap, which is likely to persist.
- This shortage, combined with the difficulty in increasing production, could have a significant impact on silver prices and availability.
The issue with a silver price surge past $50 is that it will be so powerful, because of its triple top breakout over 45 years. The energy that will be unleashed, once silver moves past $50, is tremendous. In that scenario, silver has to go to the $100-120 area, simply because of chart and market dynamics following such an epic secular breakout.
Historical silver price trend
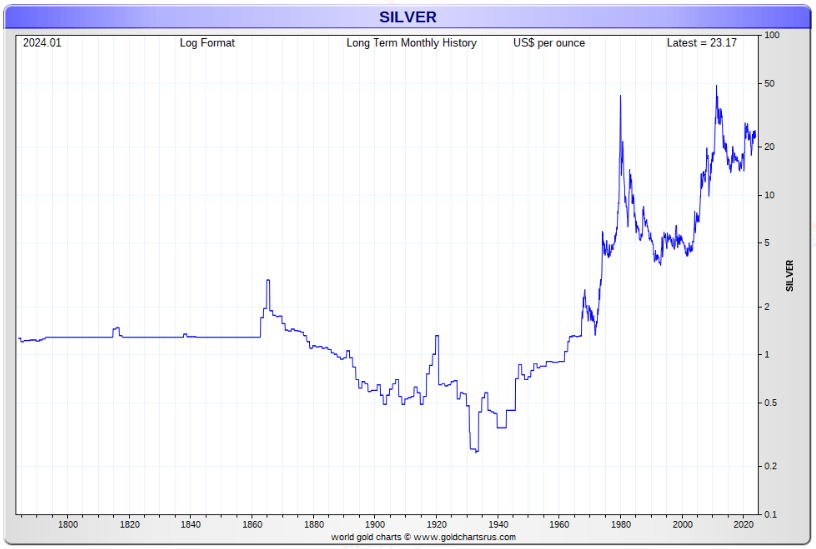
The longest silver price chart learns that silver has a relevant price history since the 70ies.
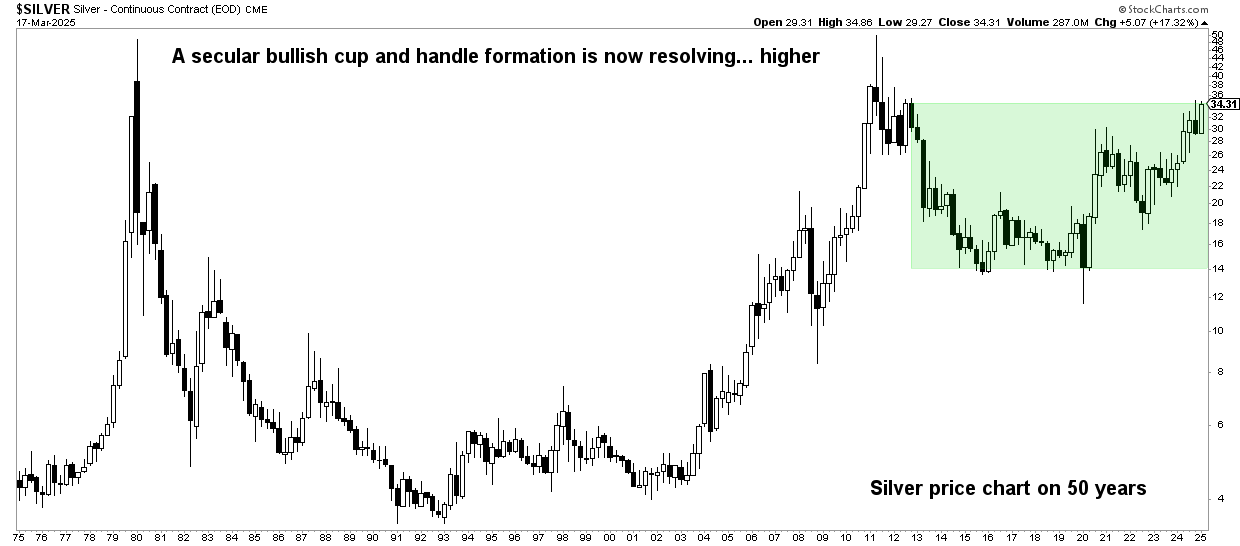
That’s why the longest relevant timeframe for silver’s price chart is 50 years.
RELATED – Insights from our 50-year silver chart analysis.
That said, if we zoom out a few centuries, and look at the silver price chart, we understand that the 50-year cup-and-handle formation is the dominant pattern in recent history.
This historical silver price chart does not necessarily tell us whether silver will go to$100 an Ounce. It certainly does not invalidate the silver to $100 thesis, on the contrary. The point is this – silver’s historical chart is not sufficient to confirm a move to $100.
Silver price correlation with CPI
It gets really interesting when we consider the impact of CPI data on the price of silver.
From the learnings defined in the article 100-year gold chart:
When taking inflation into account, and adjusting the gold price for the CPI index, it gets clear how gold is a preservation of wealth and purchasing power. The historical CPI adjusted gold price looks very differently compared to the nominal gold price. It looks stable, in a wide range, not trending. That’s what capital preservation and wealth protection should look like.
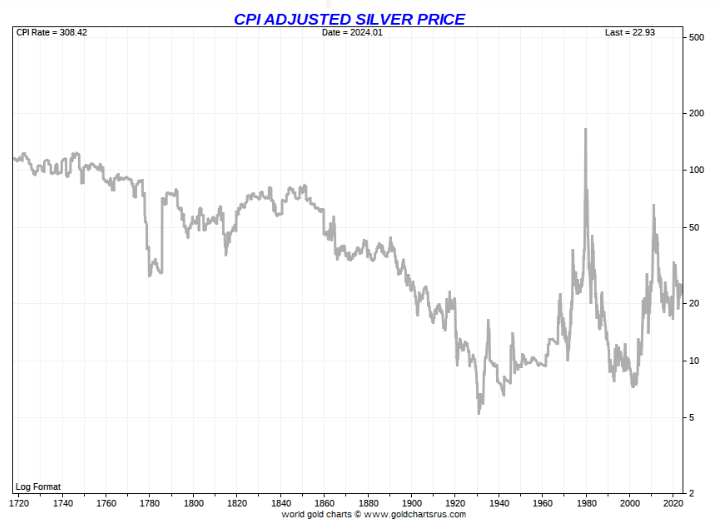
Silver price adjusted for CPI
Below is the silver price adjusted for CPI. In other words, what does the price of silver look like filtering out the CPI impact?
While the above silver price chart (USD denominated, factoring in CPI effects) shows wild swings, the one below moves in a specified range.
Equally interesting is the the absence of a swing to the top of the historical range when CPI exploded in 2022 and 2023. This clearly is because of monetary interventions by policy makers.
The probability of a delayed effect in the price of silver is high – while a delayed rally in silver may bring silver to $50, we doubt it will push silver to $100.
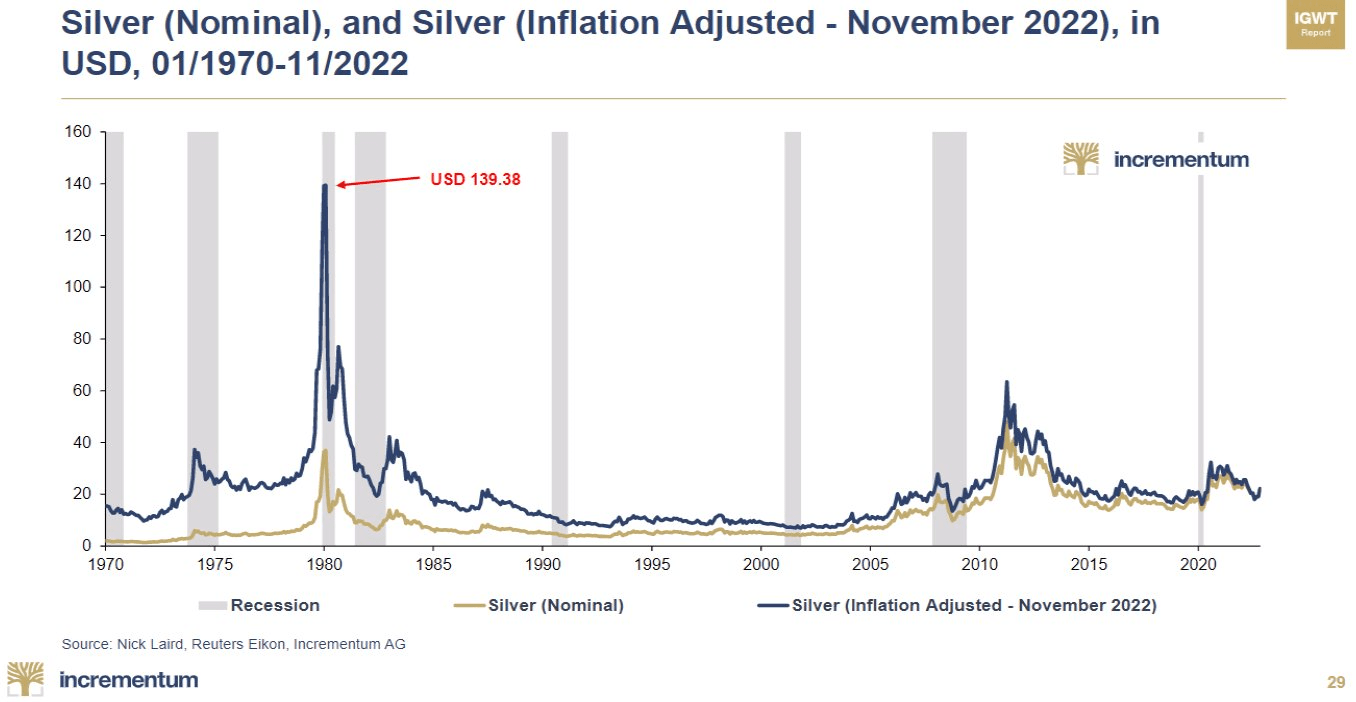
The next chart confirms the historical correlation between CPI and the price of silver, visualized in a different chart format. It also debunks the myth that silver requires a recession to rise in terms of price.
The take-away from this chart, in our view – the inflation adjusted silver price when it topped in 1980 was $139.38, this implies that the current silver price reading in USD terms is significantly undervalued. In other words, the nominal price of silver is lagging CPI which is due to monetary interventions by central banks in recent years. Consequently, when rates stop rising, silver may finally adjust to the upside.
Silver price – is there a path to $100 an Ounce?
The 50-year silver price chart in nominal terms (USD) truly looks awesome, from a chart structure perspective.
Charts don’t lie – their dominant pattern carry useful information about future price trends.
What we clearly see on the long term silver price chart is a path to its former ATH (1980 and 2011).
The cup-and-handle pattern is a reliable setup.
Note that the silver price chart remains the strongest bullish pattern on a secular timeframe that we currently see.
In other words, there is a very high probability outcome that silver will rise to $50 (former ATH) in the not too distant future. Silver will likely find resistance at its former all-time highs. This implies that the path for silver to $100 is not a given, certainly not short to medium term.
Secular silver price chart
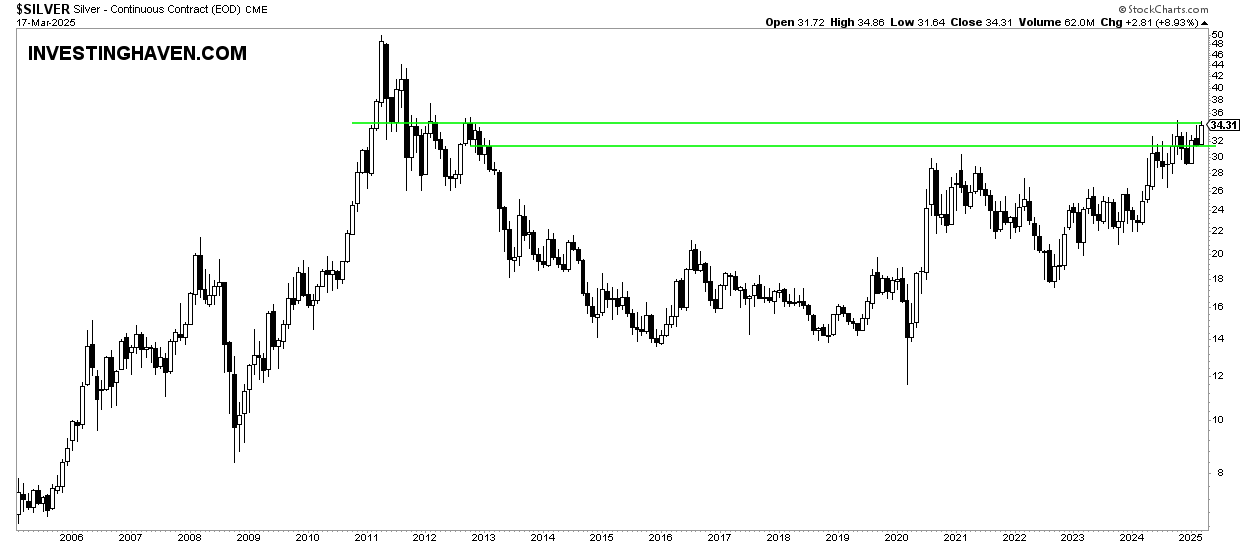
On the longest timeframes, the silver breakout is visualized as a breakout test.
Silver rose to $34 after which it came down to test $29.80 on November 14th, 2024. If $30 holds on a 3-month closing basis, in the first half of 2025, silver should be able to prepare its long overdue rally to $50.
Heraeus Precious Metals recently wrote that “industrial demand for silver is expected to surge, propelled by the continued growth in solar photovoltaic demand.”
February 18th – The 50-year silver price chart has a phenomenal setup. It is close to hitting its acceleration point. Once past $33.33 for at least 13 trading days, silver will stage a violent and quick move to $50 an Ounce, as a first target.
A silver price rise to $100 requires exceptional or extreme market conditions.
Why do we think so?
Let’s do the math – silver from the current $23 USD /oz to $100 /oz is a 5-fold rise. This is very similar to the big historical rallies from the past – 1979/1980, 2005/2007, 2010/2011. Conditions in those periods were exceptional or extreme (source):
- 1979/1980 – extreme inflation.
- 2005/2007 – extreme commodities bull market.
- 2010/2011 – extreme stimulus by the Fed (2009) to end the global financial crisis.
What could bring silver to $100? We believe either another (monetary) inflationary push and/or extreme silver shortage.
20-year silver price chart
February 18th – There is one important take-away from the detailed candlestick analysis on the 20-year silver chart: it provides info silver bull market conditions. This 20-year silver chart does not suggest that silver will rise to $100. However, is gives support levels that need to hold in order for the secular uptrend to be respected. Particularly, for the silver bull market to remain intact, the $29.80 level in spot silver should hold for a super bullish level outcome.
Silver price to $100: potential catalysts
One of the catalysts for silver to move to $100 is an extreme silver shortage. While, currently, there is a silver shortage, it is not extreme, not yet – it might become extreme.
Here is a video in which the silver price dynamics, with the developing silver shortage, are discussed. This silver shortage may develop into an extreme shortage, sooner or later.
Moreover, this X post makes it very clear – the silver shortage is growing:
What a year and decade for #silver! Using data from a new report by the @SilverInstitute, @MiningVisuals creates a new visual showing that silver could reach 710 Moz in 2024. These numbers are based on new gains in #greeneconomy applications, #AI tech, the auto sector, &… pic.twitter.com/06UPB7GtyC
— Silver47 (@Silver47co) January 1, 2025
Another catalyst might be hyperinflation – while hyperinflation is no fun to go through, it will certainly benefit silver and gold holders. We truly hope we will not experience hyperinflation in our lifetimes.
A third catalyst might be a series of rate cuts by the Fed.
Ultimately, it might be a combination of the catalysts mentioned above.
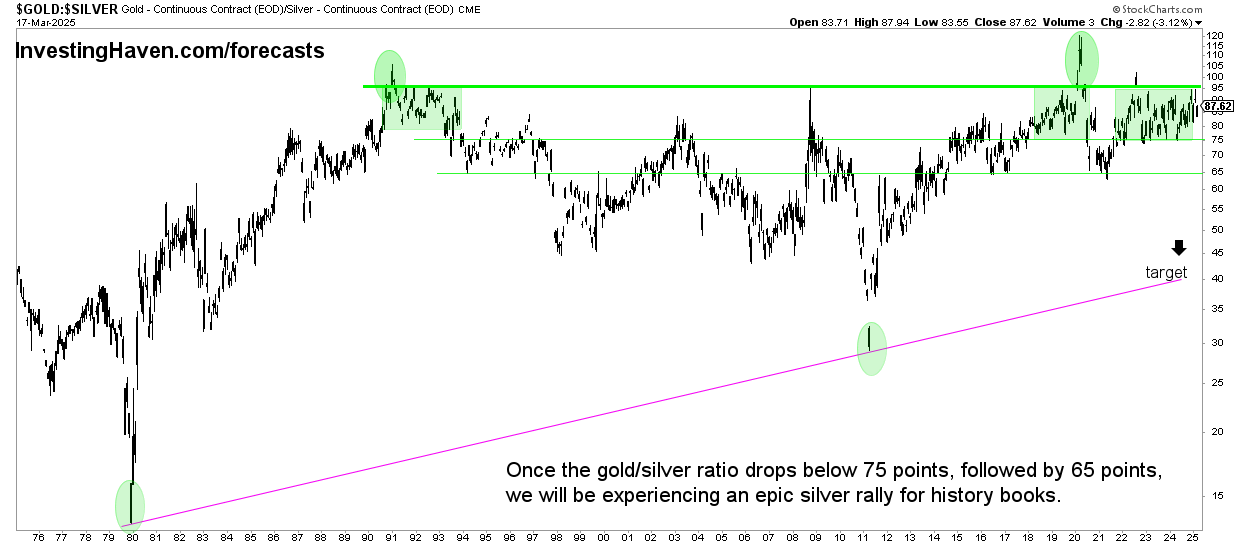
If anything, the secular gold price to silver price ratio suggests that silver will start an epic rally, sooner rather than later.
We don’t know what the catalyst(s) will be, all we know is that the similar readings in the gold to silver ratio (as an indicator) has always forecasted a big silver price swing! The silver price swing to $50 might start any time in the coming months, not later than in the period end of 2024 to early 2025.
February 18th – Watch the gold to silver ratio. This chart makes the point that silver remains hugely undervalued relative to gold. February 2025 will be a very important month according to this chart (see annotations).
Historical Silver to AUD correlation
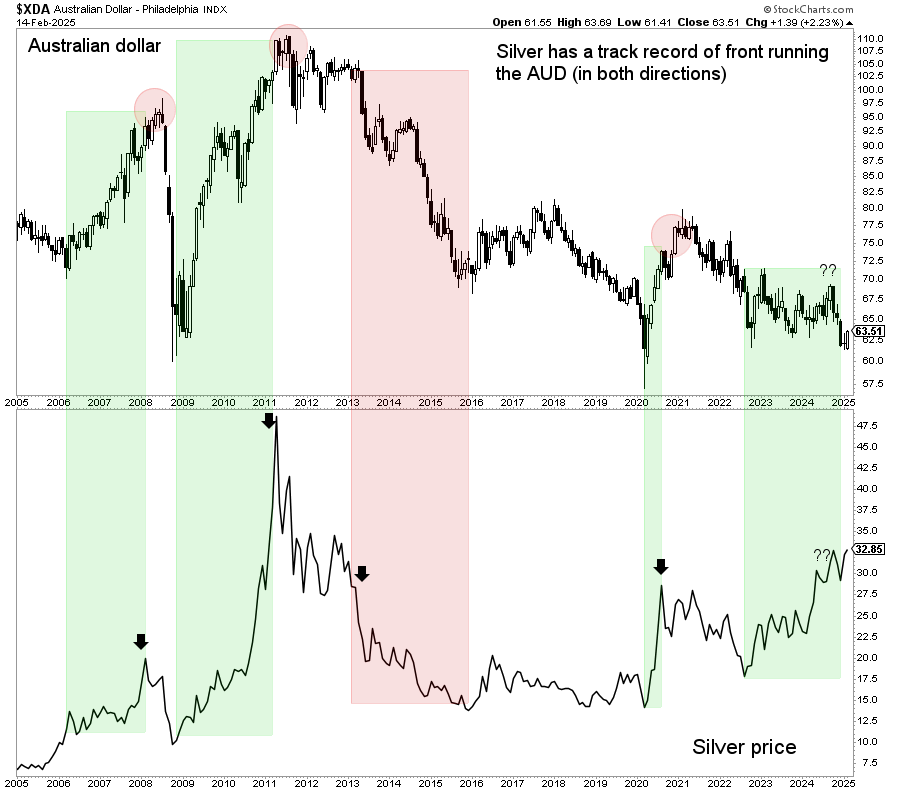
Additional evidence of a silver price rally to $50, which ultimately might push silver to $100, is the historical correlation between the AUD and precious metals.
Below is the correlation between silver and the Australian Dollar (AUD).
February 18th – The AUD and price of silver are strongly correlated. The AUD is setting a triple bottom while the silver chart is already setting higher lows. As long as the AUD respects support, it is going to support silver’s bullish case!
We agree with the take-away presented in an X post about the impact of a silver rally to $50:
You know what’s really funny about silver? The more we go up towards $50, the more bullish it gets, because at $50, a nearly 50 year old cup and handle is activated. And people still think triple digit #silver prices are unrealistic…. take another look: pic.twitter.com/DJQafpguyE
— Tim Hack (@realTimHack) May 18, 2024
Silver price to $100: timing
With all that said, the question comes up when exactly a silver rally to $100 may occur.
We want to emphasize the importance of breaking down the answer in two parts:
- The silver price rally to $50 is a high certainty outcome. It may happen in 2024 or in 2025, not later, is what all data points outlined in this article suggest.
- The big run of silver to $100 requires extreme conditions, like an extreme silver shortage or a series of rate cuts or hyperinflation or a combination. Those conditions are not visible, not yet, with the only exception being silver shortage. It is only possible to say that a silver rally to $100 is unlikely to happen in 2024 or 2025 unless the silver shortage gets completely out of hand.
Also, we want to remind readers that even the best analysts and forecasts have a really hard time getting silver price rallies right.
This one forecast did not materialize:
With a giddy up and a hi ho Silver away. $SI_F $SLV
For months I have been pointing out this long-term chart to members of the Factor Service. The massive base, completed last July, has a target of $35 to $40. Note break away gap in July & measuring gap today pic.twitter.com/BmOM6cGzfg
— Peter Brandt on February 1, 2021
FAQ about the silver’s potential move to $100
Will silver ever move to $100?
The probability of silver to move to $50 is very high. More importantly, a silver move to $100 will occur once silver clears $50, with $88 a first stretched target and $100 the ultimate stretched target.
When can silver move to $100?
If unique conditions appear, like continued inflation pressure (e.g., because of tariffs) combined with a continued silver shortage or related market conditions, silver should be able to move to $100. It seems that the bullish silver case is supported by all of these conditions now.
Is it a good thing if silver moves to $100?
It could be, but it depends on the catalyst. It is ‘ok’ to live in a world in which silver explodes to $100 only if it’s because of a silver shortage. In case of hyperinflation as a catalyst, the world will suffer a big loss in purchasing power which is not an attractive idea.
Can you provide arguments why silver may never hit $100?
There are a few reasons why silver may never hit $100. First, ATH at $50 may provide too much resistance (unlikely). Second, monetary decisions may suddenly play against silver (unlikely). Third, a complete market meltdown may push the world in a depression (unlikely in the medium term).
Is it too late to invest in silver?
It’s not too late, as long as silver is below $37.70/oz. With a clear silver price target of $50/oz, investors want to enter the silver market well below $50. Volatility will pick up near $50/oz. Better to get in too early than a few weeks too late.
Note – Thank you Adam Walsh for this mention on Linkedin.


