Silver nearly touched our $34.70 an Ounce price target. Silver chart analysis reveals November 2024 and January 2025 as decisive dates for a bull run continuation.
RELATED – Will Silver Ever Hit $50 An Once? Here Is The Answer And Must-See Charts.
However, the silver market is complex and often characterized by restless volatility, making it a challenging asset to analyze.
In this article, we delve into an in-depth analysis of silver, focusing on both the price and timeline aspects of its chart. We apply our proprietary methodology that combines technical analysis and Fibonacci principles applied to both price levels and timeframes.
Silver Is A Complex Market
Silver is known for its volatile nature. Unlike gold, which often serves as a stable safe-haven asset, silver prices can fluctuate wildly due to a variety of factors, including industrial demand, geopolitical events, and macroeconomic trends. This volatility can be daunting for investors, making it difficult to predict price movements and requiring a strong stomach to handle the market’s ups and downs.
Moreover, the silver chart itself can be quite complex. Patterns may not always follow conventional technical analysis rules, and sudden price swings often coinciding with changes in market forces can create confusing signals.
This is where our unique methodology comes into play, offering a structured approach to deciphering the chaos and identifying key trends and opportunities.
QUESTION – When Will Silver Hit 100 USD?
While, eventually, silver will move much higher, the question is when exactly. We don’t rely simply on price analysis (like this simplified silver post on X); we take price and time into account for richer insights.
Silver Price Analysis
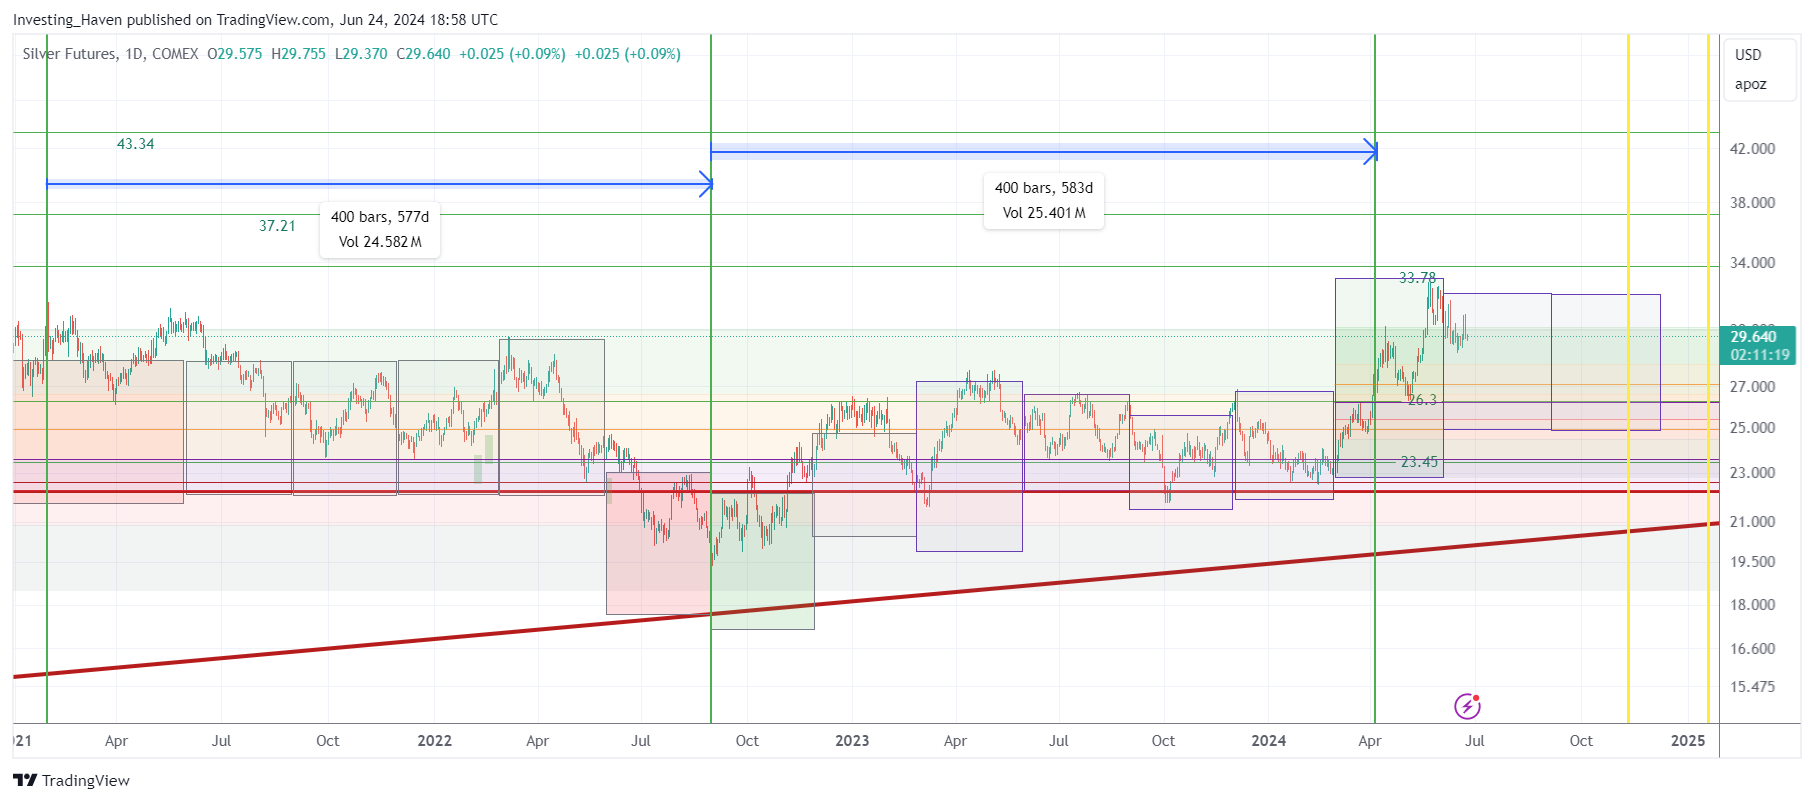
Let’s start by examining the critical price point for silver, which we refer to as the ‘line in the sand’ level—28.88 USD/oz. This price is significant for several reasons:
- Breakout Level: On the daily chart, 28.88 USD/oz marks a crucial breakout level. When silver crosses this level, it signals a potential shift in market sentiment from bearish to bullish.
- Fibonacci Extension: This price also represents the 100% Fibonacci extension level of 14.4, a historically important point on the silver chart. The Fibonacci extension levels are derived from the Fibonacci sequence, a series of numbers that frequently appear in nature and financial markets, and are used to predict future price movements.
Understanding these factors helps us appreciate why 28.88 USD/oz is such a pivotal threshold for silver. It is not just a random number but a convergence of key technical indicators that signify a major potential turning point in the market.
Silver Timeline Analysis: The Fibonacci Secret
Now, let’s turn our attention to the timeline analysis—a unique aspect of our methodology. This involves applying Fibonacci principles not just to price but also to time, which is less common and provides a different perspective on market movements.
The silver chart, above, shows that it took an extended period to complete a bullish W-pattern. This pattern is a strong indicator of potential upward movement. Here’s how we apply Fibonacci numbers to understand the timeline for silver’s consolidation and future movements:
- Fibonacci Numbers and Time: Fibonacci numbers are used to predict future events in financial markets. In this case, we use certain percentages of the time it took to form the W-pattern to estimate the duration of the ongoing consolidation.
- Key Consolidation Period: Based on our analysis, we estimate that the consolidation around the breakout level of 28.88 USD/oz might continue until a key date in November 2024. Around this time, silver could start its next bullish phase, potentially reaching $50.
- Another Critical Date: There is also another significant period, which brings us to January 2025. This is another critical timeframe when we might see significant movements in silver’s price.
By applying Fibonacci principles to both price and time, we can provide a more comprehensive analysis of the market.
However, the specific calculations and percentages we use to arrive at these critical dates are part of our premium research service and are reserved for our premium members. In our gold & silver market reports, we will share the two very specific dates that we derive from timeline analysis, both dates should mark strategic milestones for silver’s bull run continuation.
Silver: The Restless Metal
Investing in silver is not just about understanding the current market conditions but also about preparing for its restless nature.
The market’s volatility requires investors to be vigilant and adaptable, ready to respond to sudden changes. This restless nature is both a challenge and an opportunity.
Our analysis aims to offer investors with the tools needed to understand and anticipate these market movements. By focusing on key price levels and critical timelines, we provide a roadmap for navigating the silver market’s inherent volatility.
Conclusion
In this article, we have shared our detailed analysis of the silver market, focusing on key price levels and the timeline for potential movements. By combining traditional technical analysis with Fibonacci principles applied to time, we offer a unique perspective on where the silver market might be headed.
As we approach the decisive dates of November 2024 and January 2025 (exact dates will be shared in our premium gold & silver market reports), we will continue to monitor the market closely. This scenario is not a forecast but a way to illustrate our methodology. Stay tuned for further updates as we navigate the exciting and dynamic silver market in 2024 and beyond.
Understanding the silver market’s complexity and volatility is crucial for making informed investment decisions. Our proprietary methodology aims to simplify this process, offering clarity and actionable insights in an otherwise turbulent market.
For those interested in the detailed calculations and specific strategies, we invite you to join our premium research service, where we share in-depth insights reserved for our most dedicated members.


