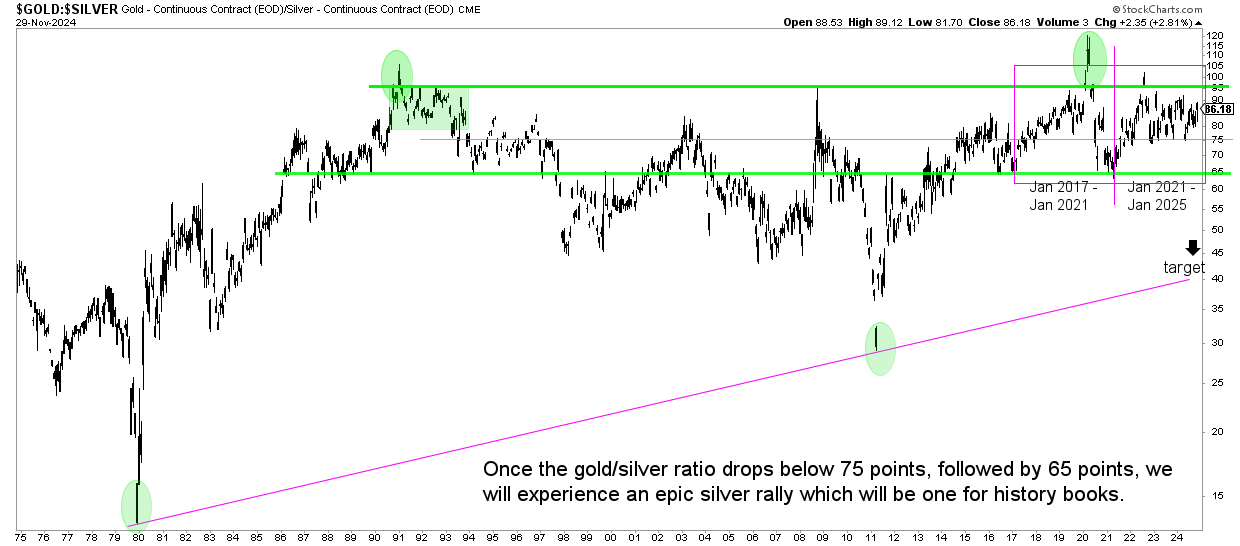
In this article, we analyze the timeline of the gold to silver ratio chart which suggests that January 2025 can potentially become the end of the silver undervaluation.
RELATED – Silver price forecast 2025
As said many times in the past, analysts are overly focused on the price axis of the chart(s).
At InvestingHaven.com, we also analyze the time axis of the chart(s). This allows us to get many more insights of the charts.
When analyzing price only, it is like missing out on 50% of the chart insights which are available on the timeline axis.
A bearish pattern on the gold to silver ratio chart
The one data point that makes us conclude that January 2025 is a hugely important month is the gold to silver price ratio.
Again, all analysts are focused on the price axis. While the price axis reveals relevant and important information, like the take-away annotated on the chart, there is an equally important timeline axis that reveals critical insights.
Specifically, the bearish M-pattern on the long term gold to silver price ratio ratio chart, shown below in the purple box, has a potential end point in January of 2025. If the completion of this M-pattern is confirmed, it will occur in the period Jan/Feb 2025, which implies a steep drop in the gold to silver ratio.
Remember – a bearish evolution on the gold to silver ratio implies a bullish outcome in favor of silver.
The above scenario would result in a steep rise in the price of silver, adding to confidence that silver is headed to $50. In that scenario, a silver price of $100 remains a possible outcome, long term.

What might happen with silver in January 2025?
Well, first off, we are talking about a potential outcome, not a guaranteed outcome.
If there was a time in which silver could start outperforming gold, it should and could be Jan/Feb 2025.
That’s because the gold to silver ratio has this M-pattern structure which has a mid-point (Jan 2021) exactly 4 years after it originated (Jan 2017). Consequently, for this M-pattern to be perfectly symmetric, it needs to conclude in Jan 2025.
This may result in a drop below 65 points in the gold to silver ratio which would coincide with a rise in the price of silver to at least 37.70 USD/oz, one of our higher targets (but not the ‘end point’).
But silver is bearish now, right?
Wrong, silver is not bearish.
It may FEEL bearish because it is not moving higher lately; relative to other markets like some tech stocks and other stock market segments it is lagging.
This may be a temporary phenomenon… or not.
What matters is price action:
- Above $26 /oz, silver is in a long term bull market.
- Above $28 /oz, silver is in strong bull market.
- Above $30 /oz, silver is in a very strong bull market.
- Above $32.70 /oz, silver is in a super strong long term bull market.
To all the price points mentioned above applies the 5 to 8 day closing price rule.
It does not happen often but we’ll feature an X post. The outcome shown below is a feasible path for silver:
$Silver may just be the most bullish chart of all time. pic.twitter.com/q3MUdiDE0F
— Sqeaky Mouse (@TheSqeakyMouse) November 30, 2024


