August 2024 will either offer an epic buy the dip opportunity, the last one before the big rally starts, or it will be a breakdown month.
RELATED – When will silver hit $50 an Ounce?
As the market likes to play games, we might also have a failed breakdown below the decisive 28.80 USD/oz level. A failed breakdown would lead to a recovery after 3, 5, 8 or 13 days.
Silver price chart – August 2024
Silver experienced a steep drop in recent days.
This should not come as a surprise, as we have been warning for weeks that precious metals leading indicators are in a ‘red hot’ state (source: premium research notes in our gold & silver market reports).
With that said, if we look at the short term timeframe, focusing only on the silver price chart (excluding the more important leading indicators) we see a steep drop to silver’s breakout level.
Our silver price prediction 2024 of 34.70 USD/oz (which is the same price target as our 2023 silver forecast) is, once again, postponed, even though silver came very, very close to our target on May 20th, 2024.
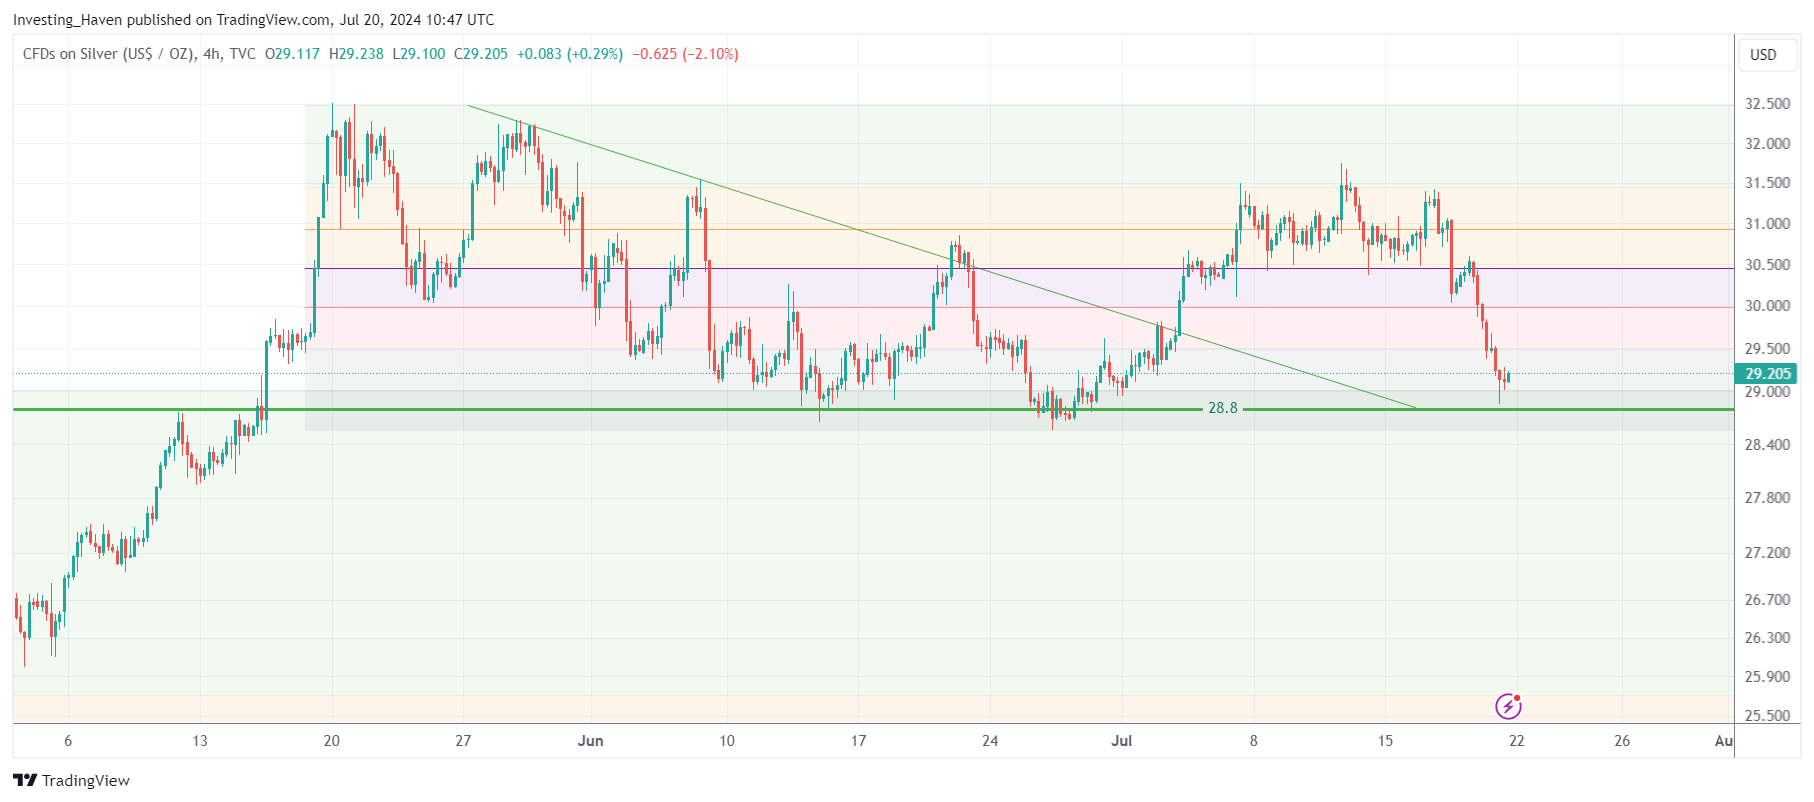
Chart – Tradingview
Silver price – catalyst in August 2024
Which catalysts are there for silver (and gold) in the month of August 2024?
RELATED – Will silver ever hit $100 an Ounce?
There are many catalysts, and they will create big swings in the price of silver. The only question is in which direction(s): one direction, two directions, multiple swings up and down?
Catalysts for August 2024:
- A potentially historic meeting in which the USD Fed will make a rate cut decision, alternatively share if/when rate cuts are to be expected.
- The last month of silver’s 3 month cycle.
- The USD trading at its critical 104.01 point level, ready to move in any direction.
- A volatility window in markets according to our timeline analysis.
In other words, August 2024 will be a decisive month for silver investors.
Silver price chart – decisive dates
In this article, published on our Linkedin account, The Most Insightful Silver Chart Analysis You Will Ever Read, we calculated two dates that might be decisive for silver investors:
- 38.2% of 400 days: This equals approximately 153 days. Based on this, we estimate that the consolidation around the breakout level of 28.88 USD/oz might continue until November 8th, 2024. Around this date, silver could start its next bullish phase, potentially reaching $50. This date is represented by the first yellow vertical line on the chart.
- 50% of 400 days: This results in 200 days, bringing us to January 21st, 2025. This is another critical date when we might see significant movements in silver’s price. This date is represented by the second yellow vertical line on the chart.
By applying Fibonacci principles to both price and time, we can provide a more comprehensive analysis of the market. This approach sets our methodology apart, offering deeper insights into the potential future movements of silver.
We recommend reading this article, and following our premium gold & silver market reports as we track leading indicators and gold/silver price charts towards those dates.


