Silver price weakness brings up the question whether the silver’s bull run is entirely over or whether this is a short break before the next leg starts in silver’s bull market. It looks like it’s more of the latter. Here is why.
RELATED – Will silver hit $50 an Ounce?
While we don’t do a deep-dive analysis in silver’s leading indicators, it is mandatory to look at each and every leading indicator in order get a thorough understand of the state of the silver market.
In this article, we only look at the price axis, quickly touch upon the time axis, but we don’t cover leading indicators.
For a detailed
Silver price weakness: healthy pullback or crash?
We wrote about the silver market extensively in our silver prediction 2024. A few quotes that matter:
InvestingHaven’s research team confirms that 34.70 USD/oz is still a feasible target in 2024. Our second bullish target of $48-$50 is likely going to be hit in the first half of 2025.
A lot of influencing factors are playing a role currently. In fact, the current environment is very dynamic. It leads to many ‘mini-cycles’ which prevent investors from seeing the big picture:
While geopolitical tensions, both in the Middle East and amplified by Ukraine/Russia, in May and June of 2024, have been creating even more uncertainty but didn’t result in a meaningful move higher in precious metals. However, with the prospects of rate cuts in the US, since early July 3d, 2024, gold and silver seem to be reacting to the upside.
All in all, there is a case to be made that the ongoing weakness in silver is a pullback, a healthy one, no crash is underway. We write about all this in detail in our weekend reports: gold & silver premium market reports >>
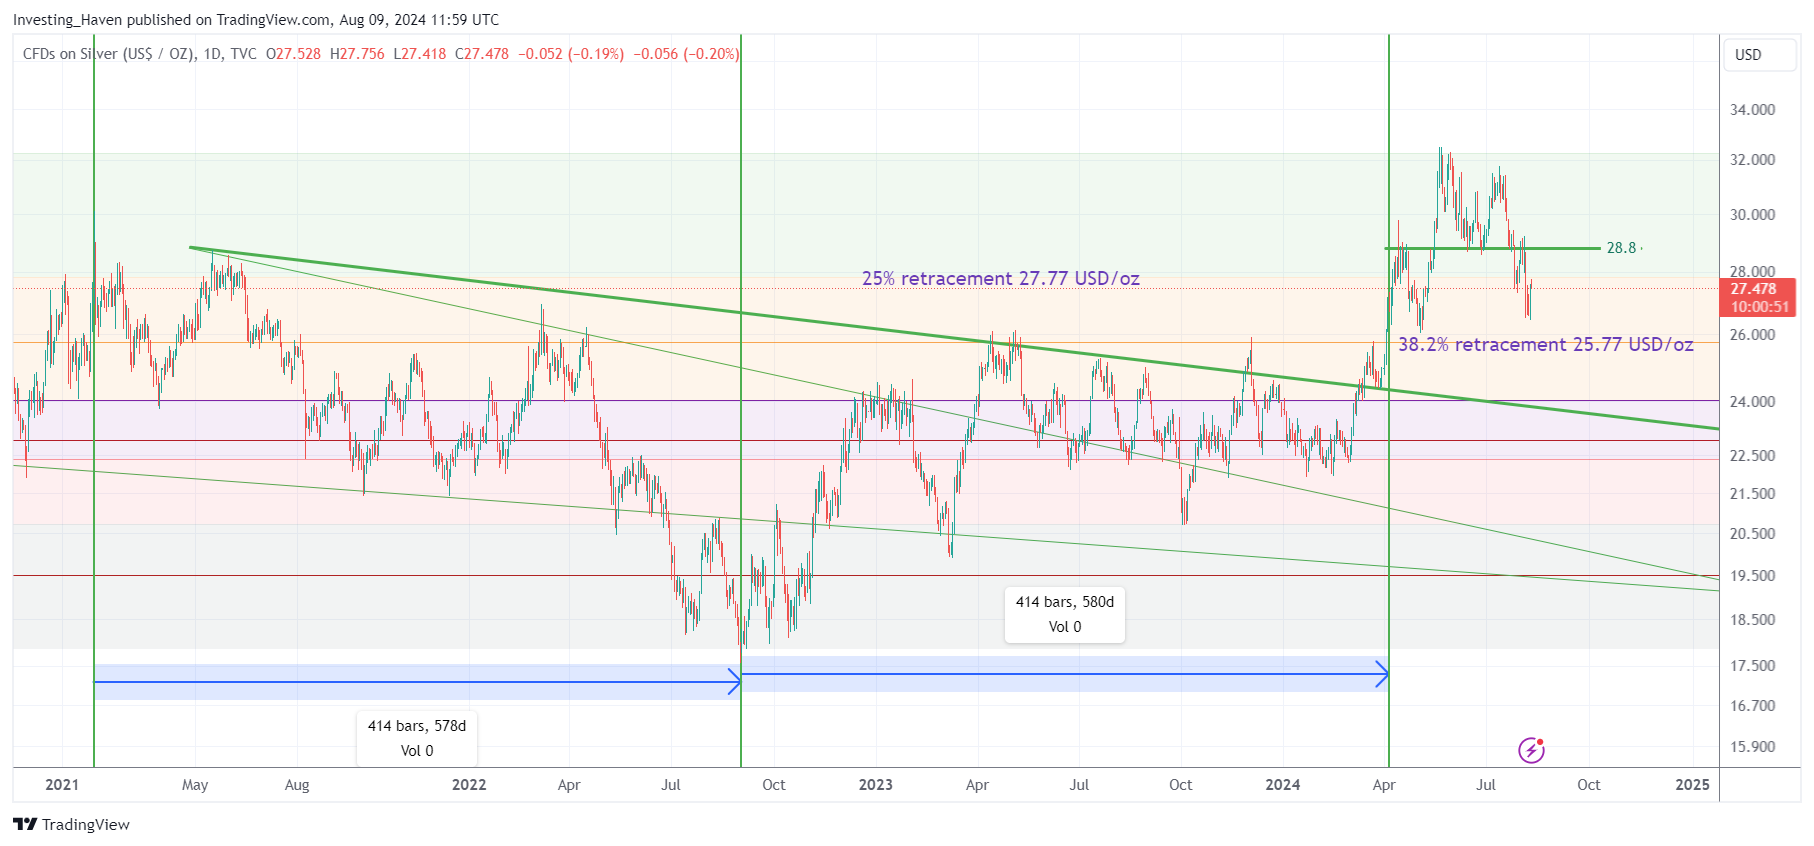
Silver price chart: key Fibonacci levels
While it is true that the silver complex is pretty complex (duh), it is also possible to simply this to some degree at least.
At the core of simplification lies Fibonacci price analysis. A bit more sophisticated is Fibonacci timeline analysis.
RELATED – Can silver ever go to $100?
While we believe that Fibonacci only solves for some of the relevant questions, it certainly is a valuable tool if used properly.
At this very point in time, key Fibonacci levels suggest that silver is testing the higher Fibonacci levels (the more bullish ones).
Another simple conclusion is that silver is bullish as long as it remains above its 50% Fibonacci level at 24.4 USD/oz. Leading indicators don’t suggest that silver will move well below the critical 50% Fibonacci level.
Silver timeline analysis
While Fibonacci price analysis is useful, even more insightful is Fibonacci timeline analysis.
From our analysis written and published on Linkedin – The Most Insightful Silver Chart Analysis You Will Ever Read:
As we approach the decisive dates of November 8th, 2024, and January 21st, 2025, we will continue to monitor the market closely. This scenario is not a forecast but a way to illustrate our methodology. Stay tuned for further updates as we navigate the exciting and dynamic silver market in 2024 and beyond.
How we derived these dates and the link with Fibonacci is explained in the aforementioned article. We recommend to read it.
The key take-away: don’t expect fireworks in silver between now and Nov 8th, 2024.
In the very best case, it will be a consolidation in Aug/Sept/Oct with a bull run continuation in Nov/Dec. That’s our best guess based on our Fibonacci time and price analysis.
Sign up to receive our premium silver market reports >>


