The silver price is well 42% below its ATH while gold printed new ATH on Friday, August 16th, 2024. This divergence is epic; it won’t last forever. Silver will sooner or later catch up with gold, there is no gold bull market without silver’s participation.
The gold to silver ratio widened to 87 points. Among the most extreme readings are 95 points in the gold to silver ratio. This means that by any standard silver is hugely undervalued compared to gold.
RELATED – Will Silver Ever Hit $50 An Once? Here Is The Answer And Must-See Charts.
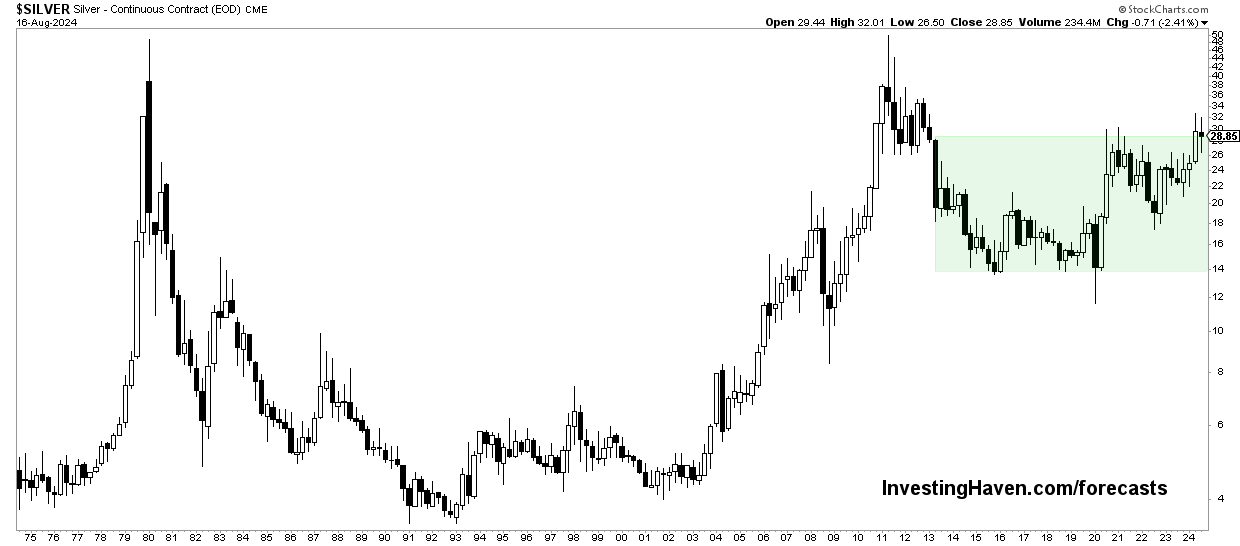
Silver chart – the most powerful cup and handle in history
We said it and will say it again – the long term silver chart is one of the most powerful cup and handle chart structures ever in history of financial markets.
Not often will investors see such a bullish reversal structure.
The silver chart is an absolute beauty; in fact, it’s a monster!
Silver currently trades 42% below its ATH. It may seems like hitting ATH sooner or later is unavoidable, we would argue that this type of chart setup may result in silver hitting $100 an Ounce sooner or later.
Silver price vs. silver squeeze
It’s interesting (read: funny) how some still call it a ‘silver squeeze.’
Since a long time, we have been focused on our 2024 silver prediction of higher silver prices to come. This prediction has a leading indicator catalyst, but more importantly it is the silver chart structure that is so astonishingly powerful.
In a way, the ‘silver squeeze’ is simply a ‘chart event’.
The same people talking about a ‘silver squeeze’ show the same bullish silver chart pattern.
Time To Send It $SLV $SILVER #SILVER #SILVERSQUEEZE pic.twitter.com/Kgmf0KQlYE
— Rock Bottom Entries August 16, 2024
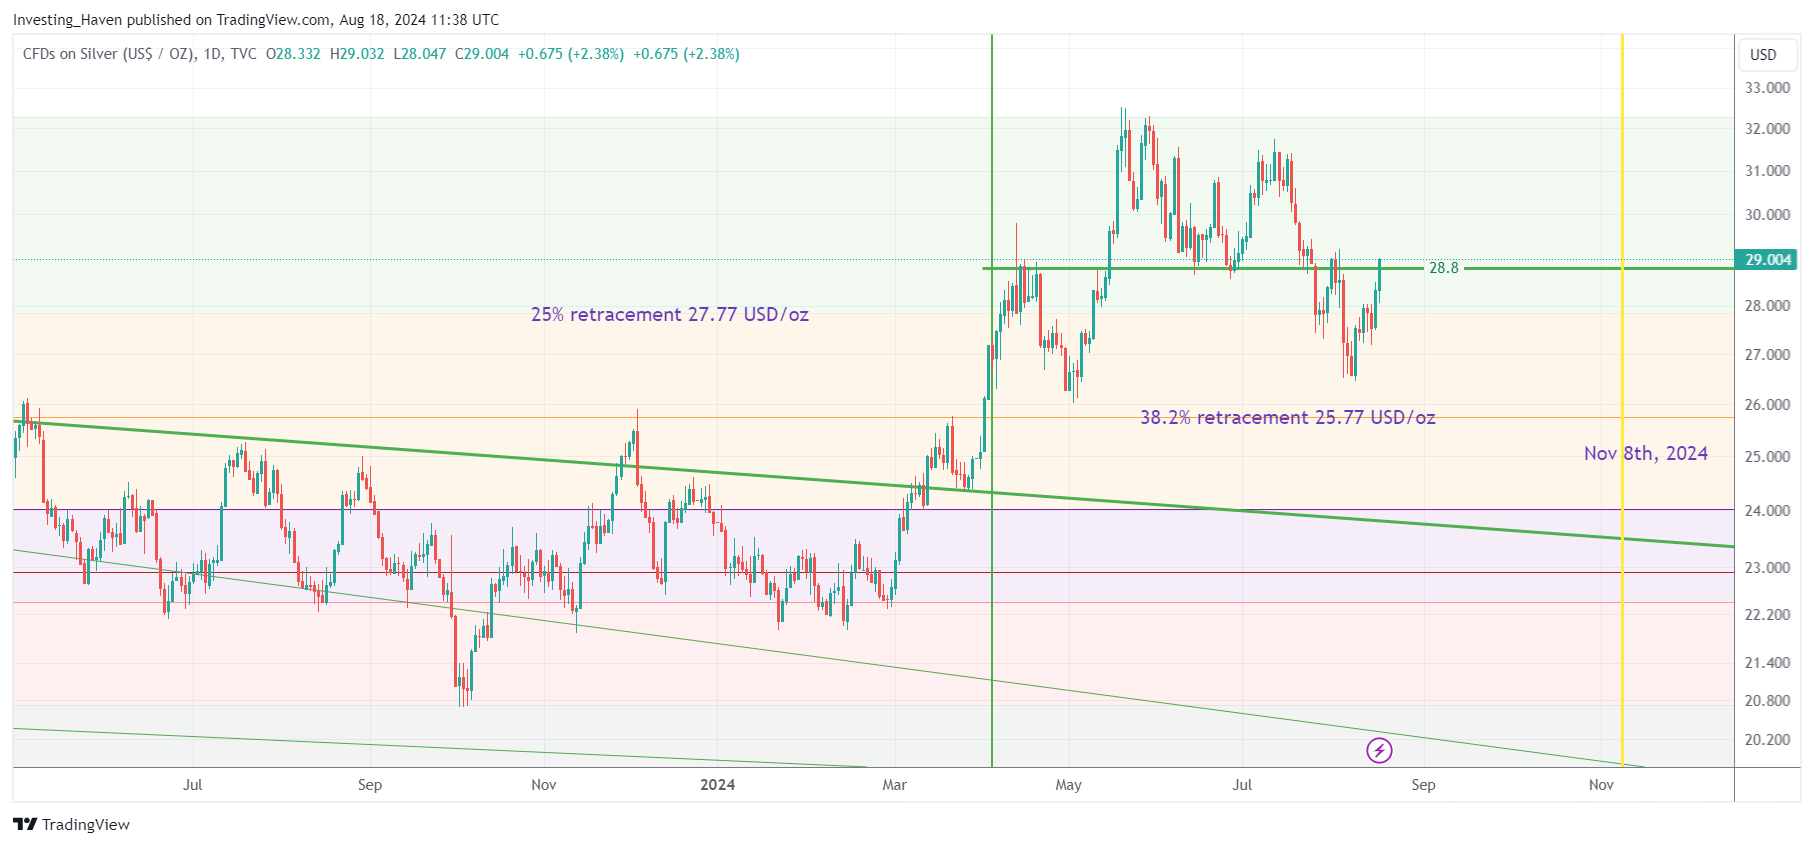
Silver price analysis – Fibonacci levels
One way to simplify reading silver price charts, to enhance silver price analysis, is adding Fibonacci levels.
Admittedly, when looking at the silver price through the lens of Fibonacci it becomes an even more interesting chart.
As seen, silver is now ‘flirting’, since 4 months, with its higher Fibonacci levels. This says it all – silver remains at or above its higher (most bullish) Fibonacci levels.
Silver price analysis – one crucial chart insight
There is one, and only one, truly critical silver price insight that every silver investor should know of.
We did document it in the research area, particularly in the section ‘Silver candlestick analysis’ in the research note shared on August 10th, 2024: [SPECIAL EDITION] The Most Comprehensive Silver Analysis You’ll Ever Read.
We consider it THE most important insight that can be derived from silver price analysis.
It is instantly available to our current premium members, and also instantly available to any new member who is looking for top notch silver guidance.


