Silver investors might learn something from examining the Tesla chart, particularly the setup prior to the start Tesla’s big secular bull run.
Before we look at the Tesla price chart and compare it with the silver price chart, let’s review some of our latest silver analysis:
A Silver Price Forecast For 2023
The price of silver will move to our first bullish target of 34.70 USD in 2023. We expect 48 USD soon after, not later than in 2024.
The Latest Gold To Silver Ratio Chart As 2023 Kicks Off
Can the gold to silver ratio ultimately move back to the long term rising trendline which now comes in at 38 points? We believe so. This might happen with a silver price of 75 USD/oz in a few years from now which could come with a gold price of 3000 USD/oz and a gold/silver ratio of 40x. That’s in 3 to 4 years from now, that’s not in 2023!
Silver: Strong Buy Once This Happens
IF (which is a big IF) silver is going to consolidate and find decent support around 21 USD/oz, it will be an outrageous, aggressive, strong BUY for the long term. It might even be the last chance to get in after which silver will not look back for many years to come.
Silver: A Divergence Of Epic And Historic Proportions
The physical market imbalance (supply shortage) is historic, it’s not just a big supply shortage jump of 4x against last year.
So, that’s lots of background on what’s happening in the silver market.
With this in mind, let’s look at the daily Tesla price chart right before it took off. Although not visible, the price of Tesla went up 10x in 2020-2021.
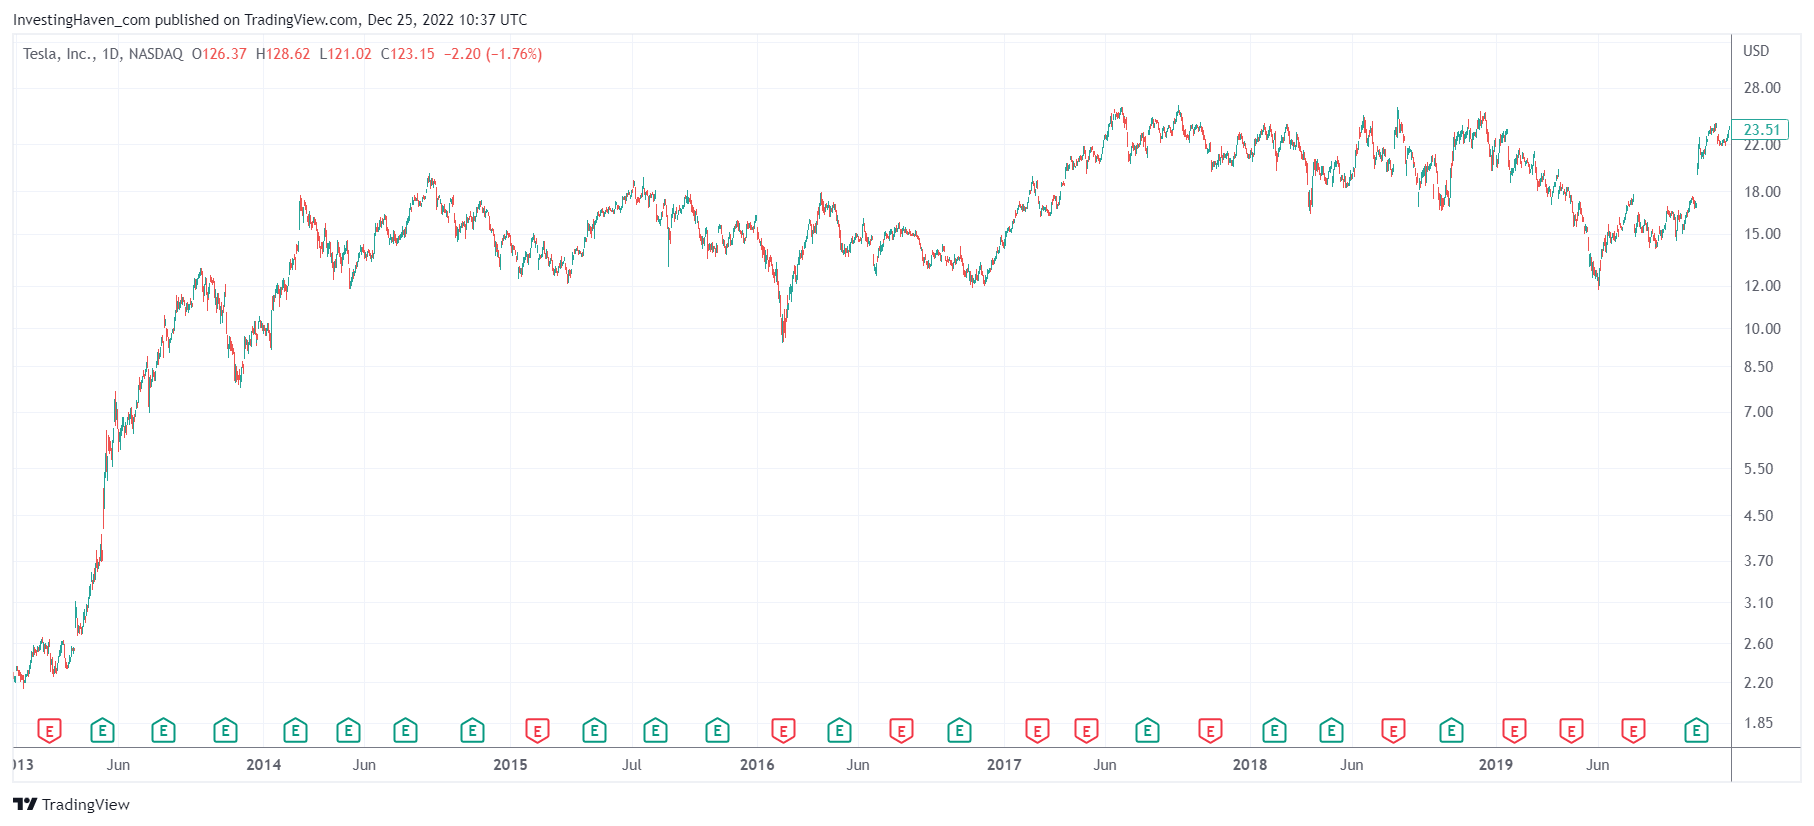
What we observe is that the Tesla price chart was a ‘hot mess’ between 2014 and 2019. Price was bouncing between resistance and support in a wide range of 12 to 25 USD.
Imagine investors that got in around 24 USD somewhere in 2018. Almost all of them, for sure, were ‘happy sellers’ when Tesla fell to 12 USD, way below the 200 day moving average (because a stock trading below the 200 dma is not good, is what technical analysis suggests).
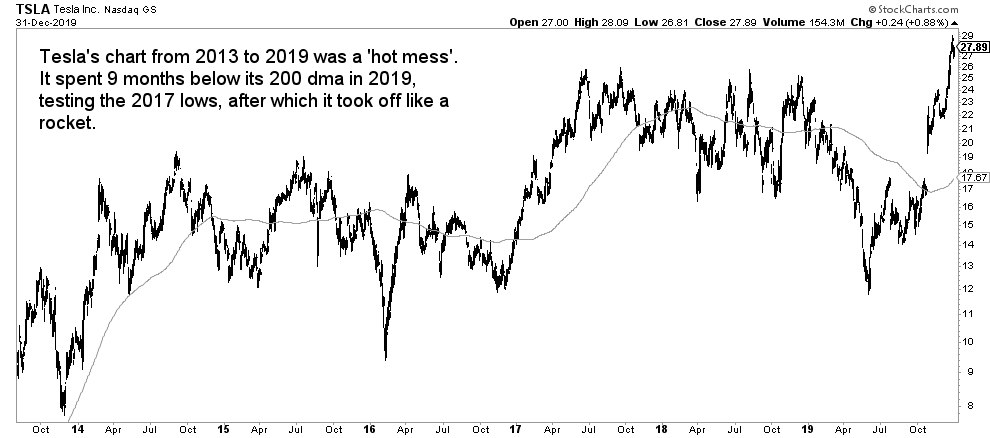 Tesla spent 9 months below its 200 dma in 2019.
It then took off and never looked back.
10x is what Tesla holders got.
Not a lot of them were able to hold.
Let’s look at the price of silver today!
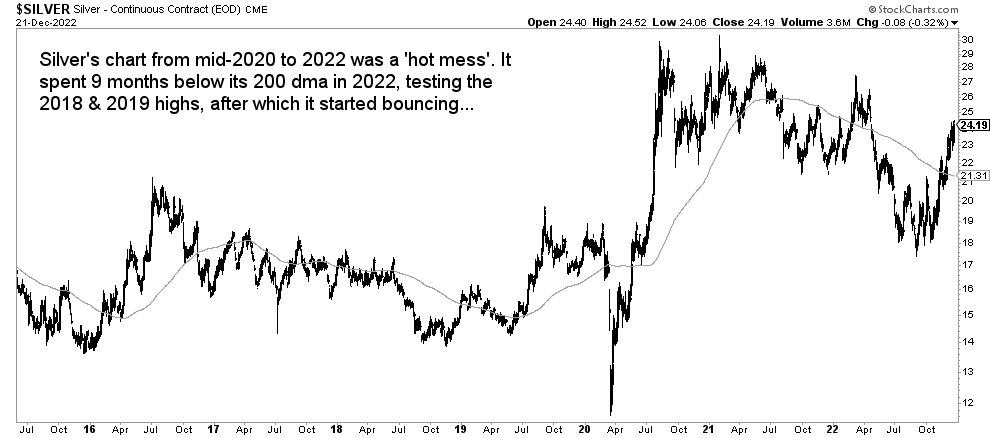
Silver spent 9 months below its 200 dma. It was a ‘hot mess’ since the summer of 2020. Imagine that, silver is going nowhere for 2 years now. What a disaster, right? Why fool wants to hold silver, right?
Not that fast is what we would argue.
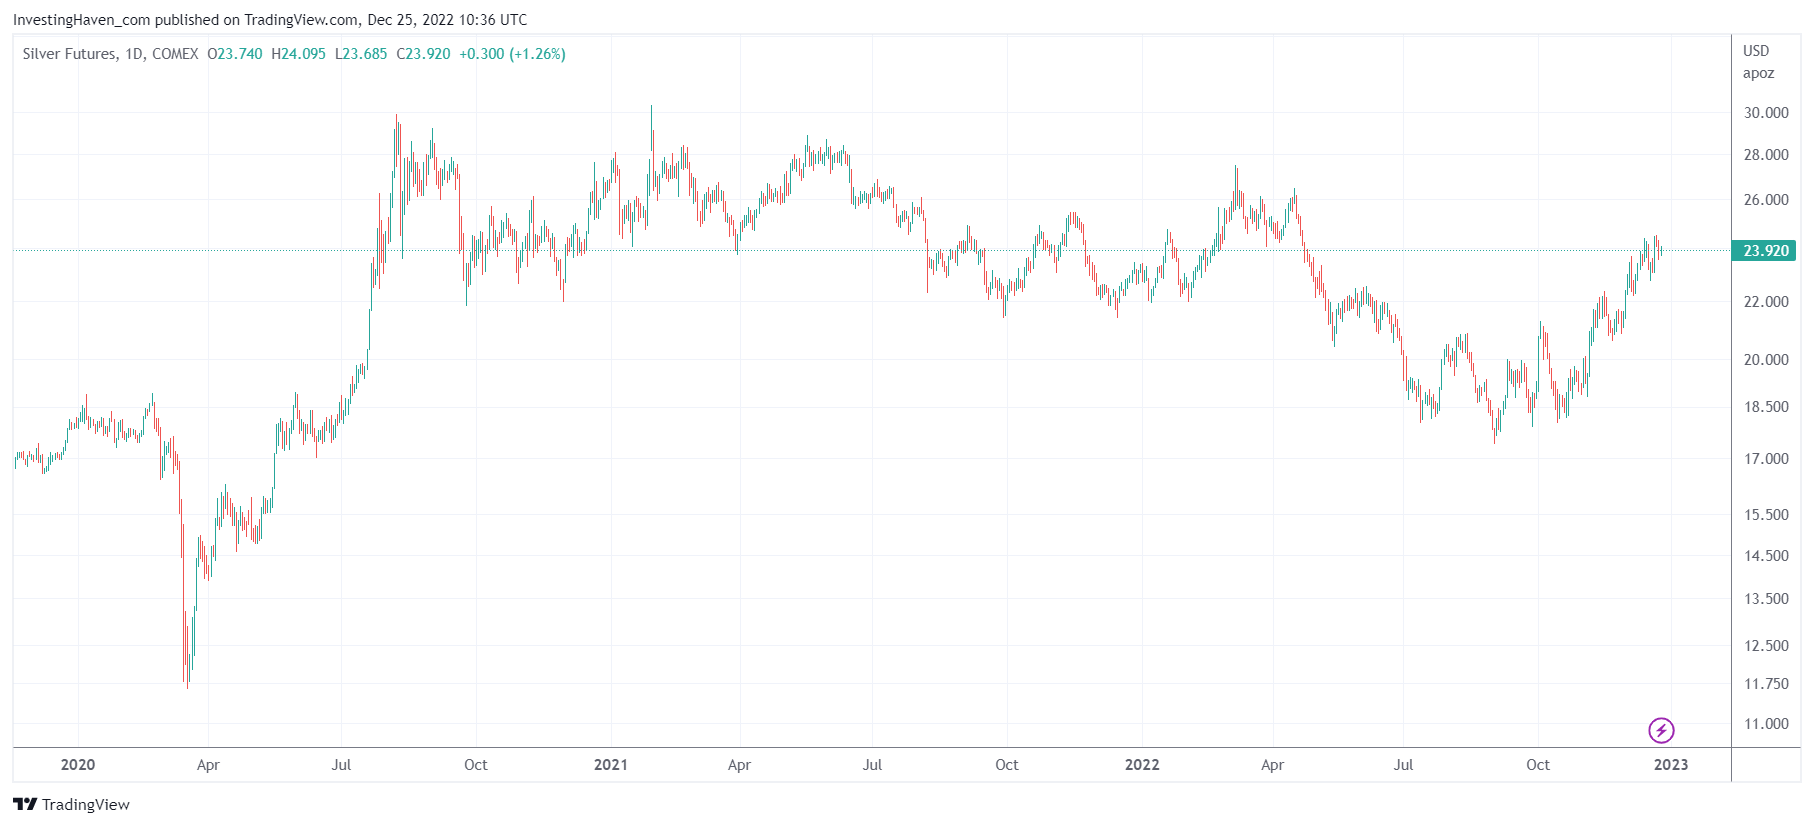
Silver has been consolidating between 28 and 21 USD for some 24 months after which it dropped below 21 USD for some 6 months. It is now back in its consolidation range.
Moreover, and more importantly, silver’s 2022 lows were a successful test of the 2018/2019 highs.
What’s even more important: the decline of 2022 has the shape of very bullish reversal.
This is turning the entire consolidation of the last 30 months into a giant bullish reversal.
Here is the fun part: it’s almost the exact same setup as Tesla’s setup back in 2019.
If we look at a candlestick chart of Tesla prior to taking off and compare it with silver, both charts below, we see one big difference.
While Tesla’s chart had a very bullish setup…
… silver’s chart today is even more bullish. That’s because the last 9 months have the shape of a multi-leg W reversal.
Did we say that we are wildly bullish silver in 2023 and beyond?
