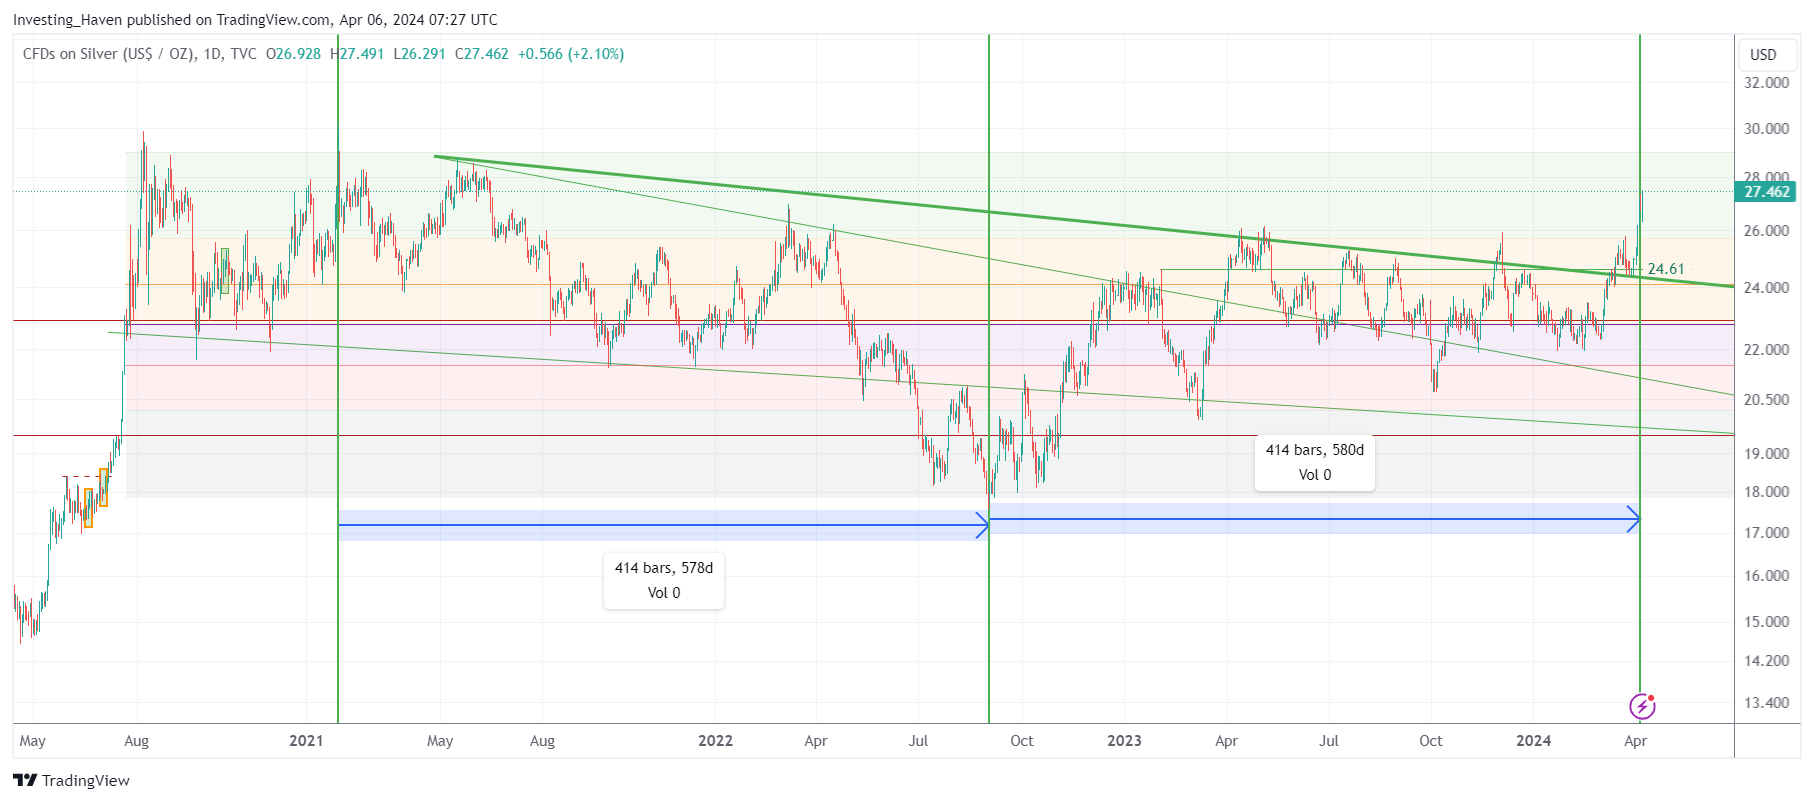
After 828 days, the bullish reversal on silver’s price chart is complete. If silver continues to move higher, it will be the ultimate secular bullish breakout confirmation which will come with multi-year implications.
Related – When Will Silver Start A Rally To $50? and our Bullish 2024 Silver Prediction.
We look at a broad set of data points to understand the silver market. Most of the times, our contrarian view differs from mainstream media, which we love by the way.
To illustrate this – we turned very bullish on silver in Feb/March while mainstream media was not paying attention (this is the only exception).
Silver bullish reversal now complete
99% of analysts focus on price only. The silver chart, like any other chart, has two axes. By focusing on price analysis only, analysts ignore 50% of the insights that the silver chart has to offer.
It gets really interesting once timeline analysis (x-axis) is included in silver analysis. Note – we always look at the gold and silver charts from a price + timeline perspective to ensure we maximize the insights out of the charts.
Stated differently, we make silver price analysis meaningful.
This is a snippet from our most recent gold & silver market report which is a detailed and must-read analysis for any gold/silver investor:
- Silver set a secondary high on Feb 1st, 2021 (green horizontal line). That’s when the bullish reversal started, it initially started with a decline.
- Silver set a lasting bottom in Sept of 2022, after 414 days. This is the midpoint of the bullish reversal.
- If we add another 414 days to the lowest point, it brings us to April 5th, 2024.
So, in essence, we can conclude that silver’s bullish reversal is now complete. This confirms our view that IF there was a great time for silver to stage a breakout, it would be NOW.

Silver’s most important 3-month cycle of this decade
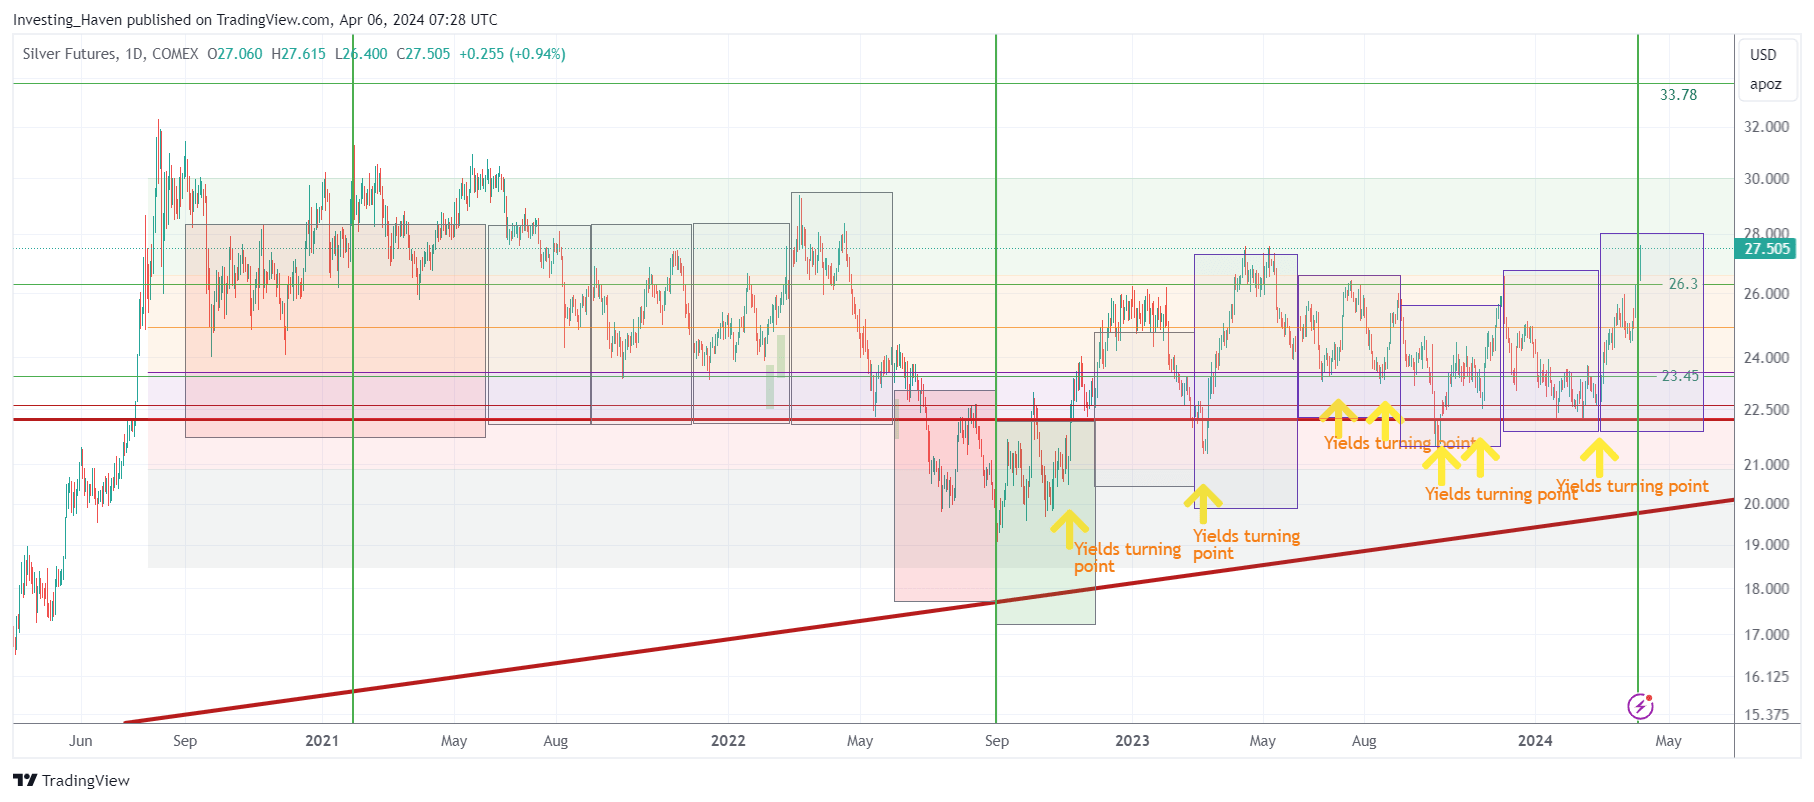
While the above timeline analysis on the silver chart reveals a very important insight, it should be combined with additional timeline readings. More specifically, we always think analyze the price of silver (and gold) against their 3-month cycles.
Below is the 3-month cycle chart for silver.
Key take-away: the 3-month cycle chart suggests that silver has another 7 weeks in this bullish cycle.
This view of the chart suggests that IF there was a great time for silver to stage a breakout, it would be NOW. Again, this is not the only silver chart that stands out, there is another secular timeline view of silver that is equally more important and made available in our premium alert The Ongoing Silver Rally – Will It Become Historic).

Silver’s undervaluation might not last for much longer
One of the important questions that silver investors are asking is how high silver may move.
Related – The 50-Year Silver Price Chart
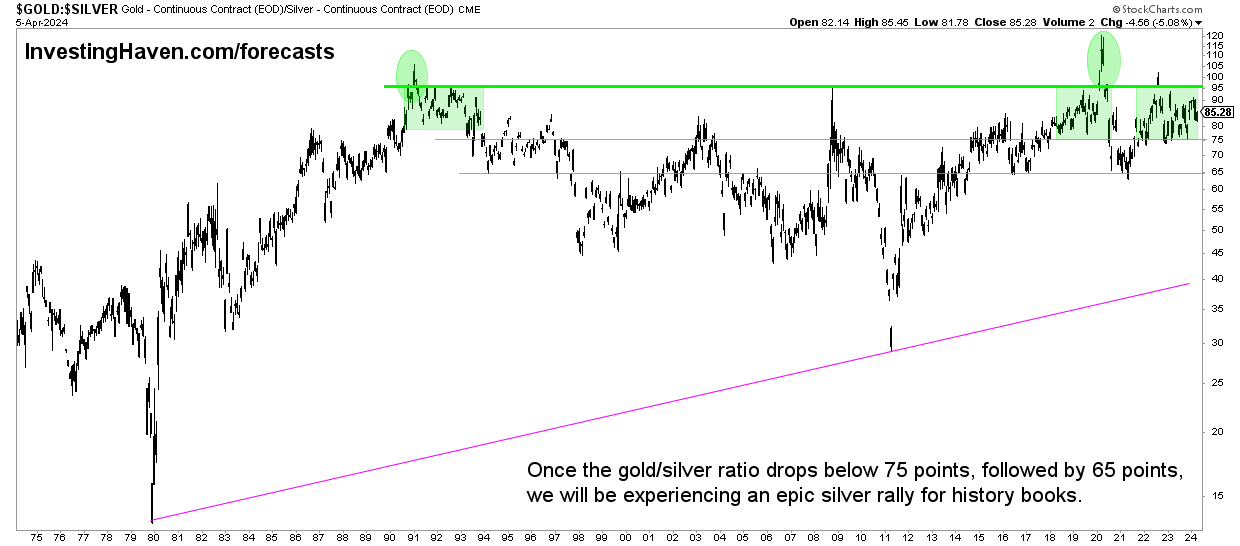
It is really simple in our view – the gold to silver price ratio is the one that is useful to understand the upside potential in the price of silver.
As seen below, silver is hugely undervalued relative to gold. This undervaluation may come to an end within this current 3-month cycle.
Best case, silver moves to $50, around the start of the summer of 2024. The pre-requisite for this to happen – the gold to silver ratio should drop below 65 points.

We are tracking this chart on a weekly basis in our gold & silver market reports (not on our public blog though).
Detailed silver price & market analysis
The silver price analysis in this alert is just a fraction of the analysis that we serve to premium members, every weekend, in our detailed gold & silver analysis. To illustrate this point, in this weekend’s detailed gold & silver report we featured 24 must-see gold & silver charts.
This is the list of alerts we have sent in the last 8 weeks to gold & silver investors:
- [MUST-READ] The Ongoing Silver Rally – Will It Become Historic? (April 6th, 2024)
- Silver & Gold Miners Should Be Watched Closely (March 30th, 2024)
- Speculators Are ‘Too’ Long Gold & Silver And The Implications Of Consensus Long Positions. (March 24th, 2024)
- Exceptional Circumstances In The Silver Market (March 17th, 2024)
- Silver Continues To Exhibit The Most Bullish Leading Indicators + Unique Gold & Silver Mining Charts. (March 10th, 2024)
- Metals Higher. Everything Higher? (March 2nd, 2024)
- Gold & Silver Bullish Consolidation Continues. (Feb 25th, 2024)
- Silver Now Has Very Bullish Readings. (Feb 17th, 2024)
If you like our analysis, we invite you to follow our premium gold & silver alerts >>


