In our gold price forecast 2019 we identified 3 leading indicators for the gold market. Out of the 3 we see a strong supportive effect from 2 of them. This supports our thesis of mildly rising gold prices in 2019. Consequently, we see that our 3 top gold stocks for 2019 will break out at a certain point. Note as well that this article should be read together with our top 3 long term gold charts.
This is what we said in our original gold (GOLD) forecast which we published 5 months ago:
We believe that gold, in this formation, will go back up in 2019 to test the $1300 to $1375 area. As that will be the 3d attempt for gold to break out of its strong resistance there is a fair chance gold will succeed. That’s why our most bullish gold price forecast for 2019 is that gold will hit $1550 in 2019 (20% probability), but only if it succeeds breaking through the $1375. The $1375 test is a base case scenario (75% probability).
So far the price chart of gold looks perfectly on track to break above $1300, and move fast to $1375 where it will meet crucial resistance. If and once above $1375 we expect an easy ride to $1550. Note that these findings are in line with the 20 year gold chart as well as 40 year gold chart.
One of the relevant principles from our 100 investing tips for long term investors we have to apply is that capital flows between asset classes. This will result in temporary market cycles. That’s the result of ‘intermarket dynamics’. These cycles typically last between 6 and 18 months. The key is to identify those market cycles, and understand that they are subject to change.
How does this tip relate to our gold price forecast? If and once gold breaks above $1375 we know for sure that capital flows between asset classes have caused a new bull market in gold assets, which is why it is imperative to have the top gold stocks high on anyone’s watchlist.
By the way forget about gold news, the insights made above are the ones that really matter for gold investors, and any investor for that matter.
Gold Upside Potential In 2019: COT and Euro
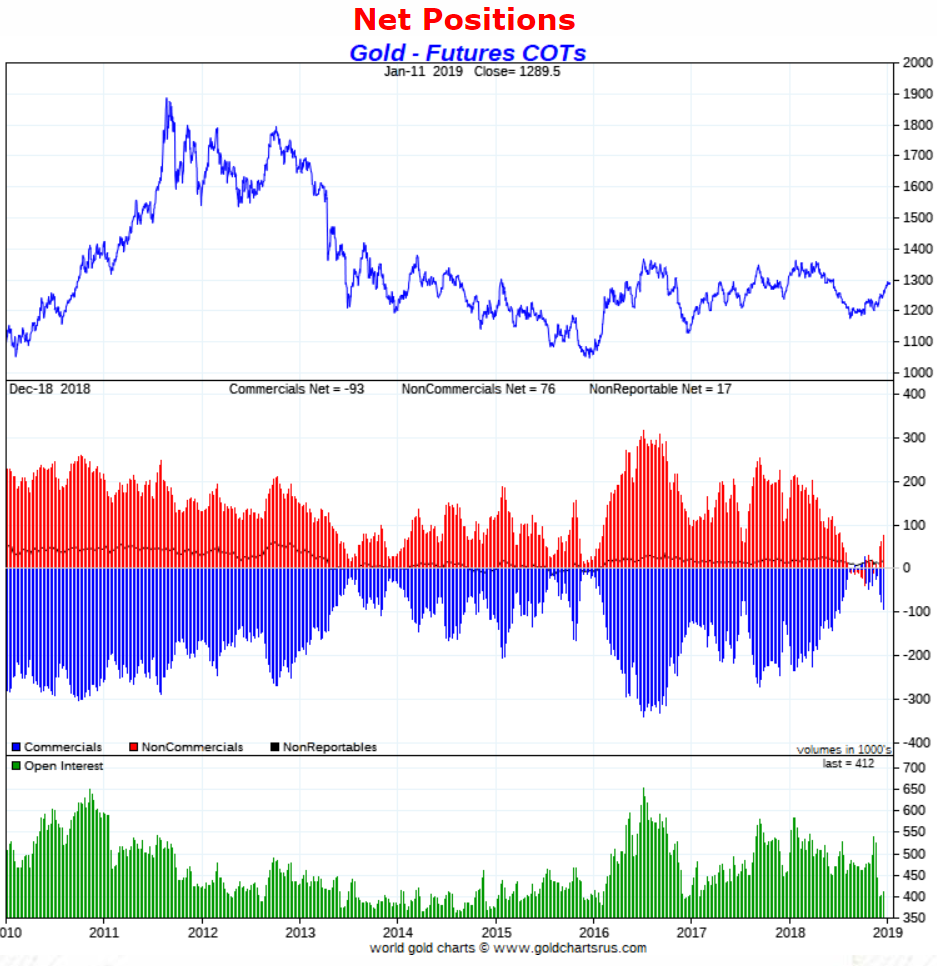
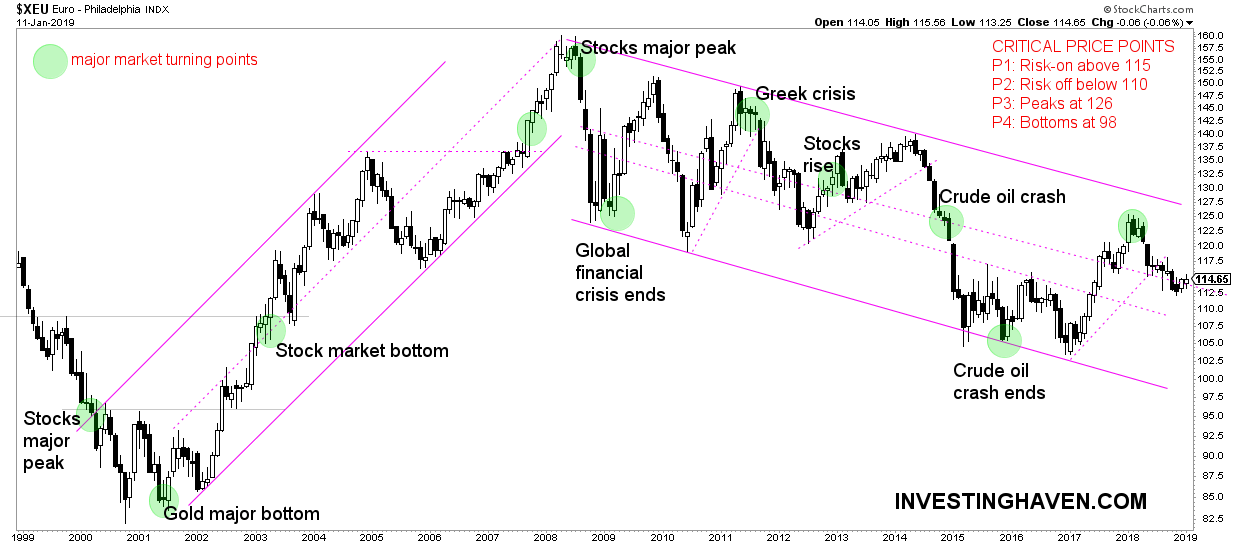
In our gold price forecast we identified 3 leading indicators: real rates, gold’s COT and the Euro. So far the COT and Euro are very supportive for gold, but falling rates have not been supportive so far in 2019. That’s why the gold price rise is mild, not wild.
Let’s review gold’s COT.
Based on the COT report we see that the recent rise came with rising readings of net positions of key market participants. Look at the positions of the largest market participants (middle pane). The number of long contracts of non-commercials was at the lowest point in 9 years (red bars) when we published our gold forecast. We only focus on extreme reading to identify major and intermediate tops and bottoms in the gold market. Right now, we see that there is plenty of potential until extreme readings in the gold futures market.
Similarly, the Euro looks set to rise which is the ideal outcome for the gold price.
As said before the Euro has been leading the price of gold. Every time the Euro tested secular support or resistance, or broke out or down, it preceded an important top or bottom in the gold price.
For 2019 it seems that the Euro is moving higher based on the current readings. Note this is subject to change as the trend is not strong at this point in time. The Euro has a track record of moving fast once it breaks out or down.


