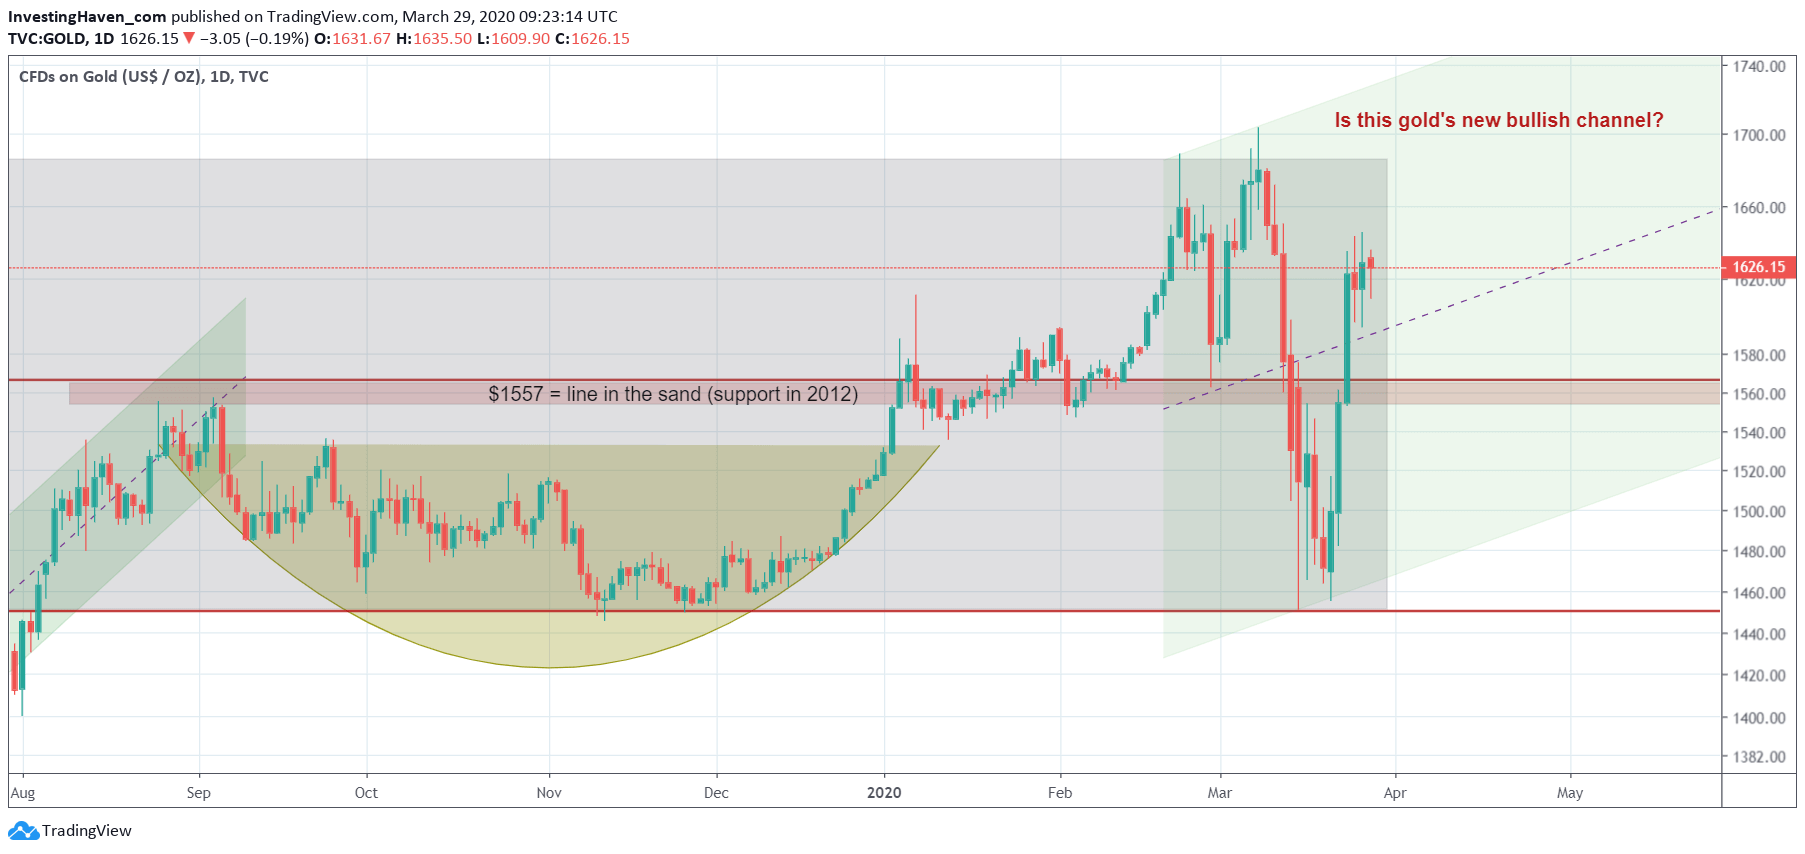
We added a Corona crash update in our annual gold forecast. It now has this title: Gold Price Forecast For 2020 And 2021 *Corona Crash Update*. The long and medium term charts are worth checking out as they put the recent crash into perspective. Below is the daily chart, equally important, to understand what may be underway. Interestingly the gold price chart shows the formation of a potential bull market channel.
The ‘art of the chart’ is really about understanding what may be underway. Using data points through price analysis helps understand when those projections may be valid or invalidated.
Interestingly the gold chart reveals a few important trends:
- The 1557 USD level is so crucially important. Although gold fell through it mid-March, it respected the 2019/2020 support at 1450 USD.
- The big crash from March of 2020 recovered fast.
- The big crash from March of 2020 created the ‘contours’ of a potential new bull market channel (in green on below chart).
If the market decides to move in this new bull market channel we will see much sooner than expected all-time highs in gold. This scenario would make sense with the catalyst being ultra low rates and helicopter money.


