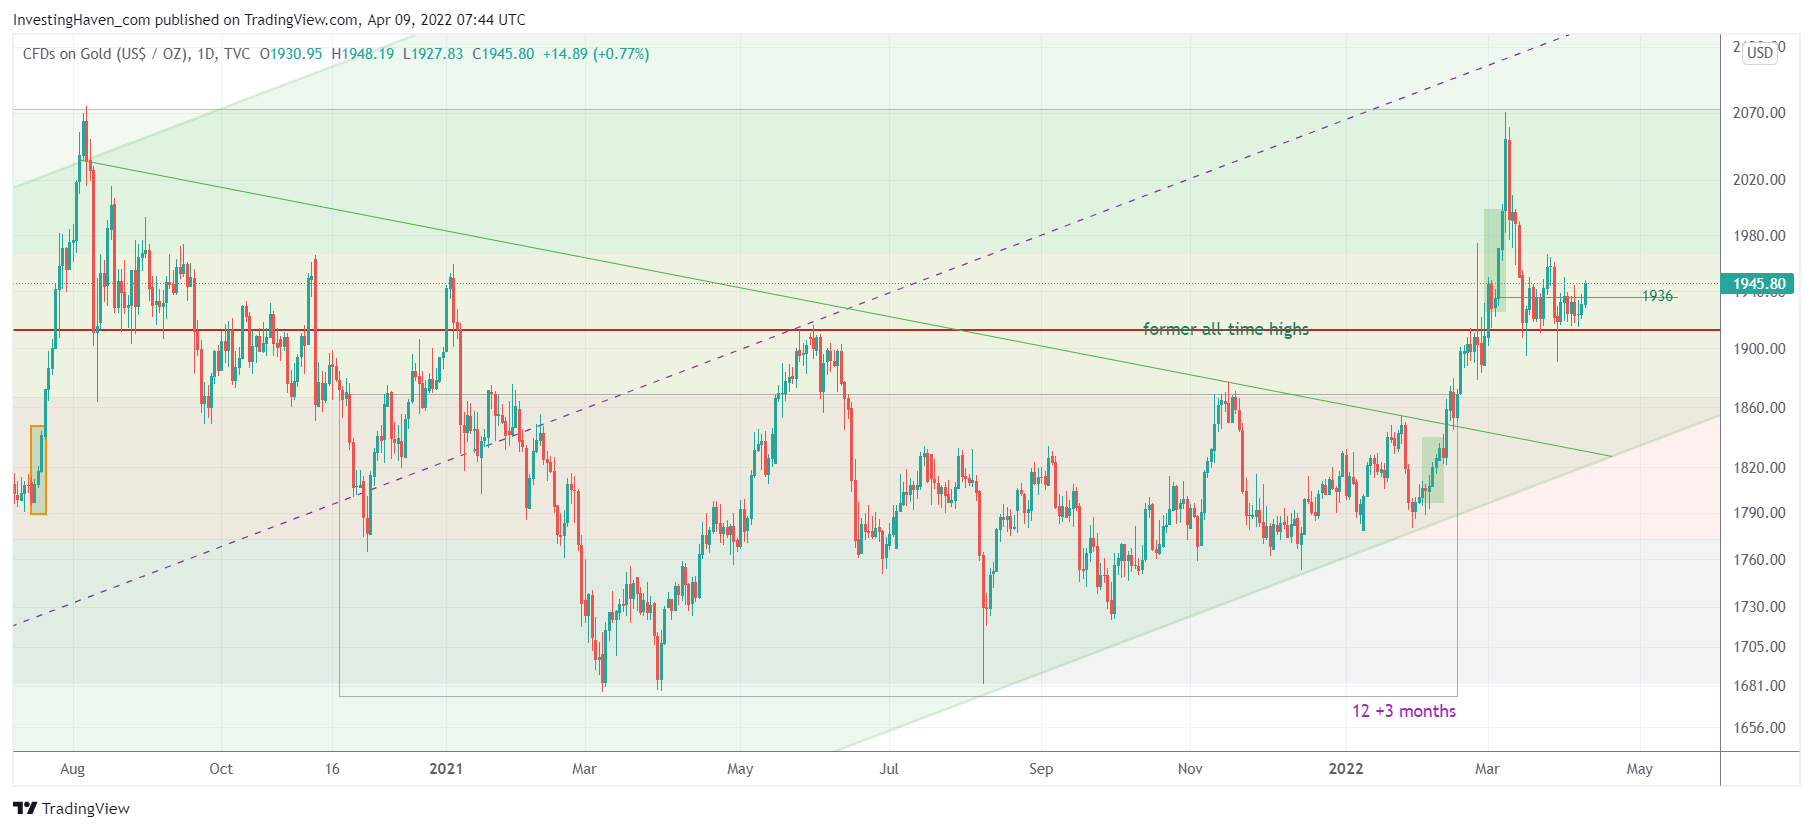
After the big run-up in commodities and precious metals, in February of this year, we witnessed a serious retracement in gold. However, the gold chart shows how former ATH have now turned into support. As long as gold’s former ATH hold we believe it will be bullish for gold but insanely bullish for silver! We believe that our gold forecast and super bullish silver prediction are underway, and the pre-requisite is that gold continues to respect its former ATH (on a 3 to 5 day closing basis).
Gold is a challenging investment, it has always been challenging but now for so than any other point in time.
Why?
Because of the narrative.
Gold is currently associated with either of the following two things:
- U.S. Fed tightening (bearish for gold).
- Russia War (bullish for gold unless the war comes to an end).
We are here, telling you: it’s the biggest illusion and most destructive narrative of 2022.
We want to remind you of the following, as per our 100 Investing Tips For Long Term Investors:
- The (number of) sources of information to make decisions are _not_ social media nor financial media. They are not meant to make you a better investor, they are meant to bring lots of content, that’s a big difference! Pick your sources according to the principle less is more.
- Patience is such an important virtue when investing financial markets. It takes time for good things to happen, and “it” starts (a rise or decline) things tend to accelerate in a short period of time. Therefore, ‘good things take time to happen but great things happen all at once.’
Let’s start with the gold chart to make our point.
While the Fed was preparing tightening and when there was no sign whatsoever of a Russia/Ukraine war the gold chart was improving week by week, month by month. If anything, the 18 month gold chart shows an insanely bullish reversal that was in the making for a long time, way before the War and when it was clear that tightening was underway.
The problem is the narrative.
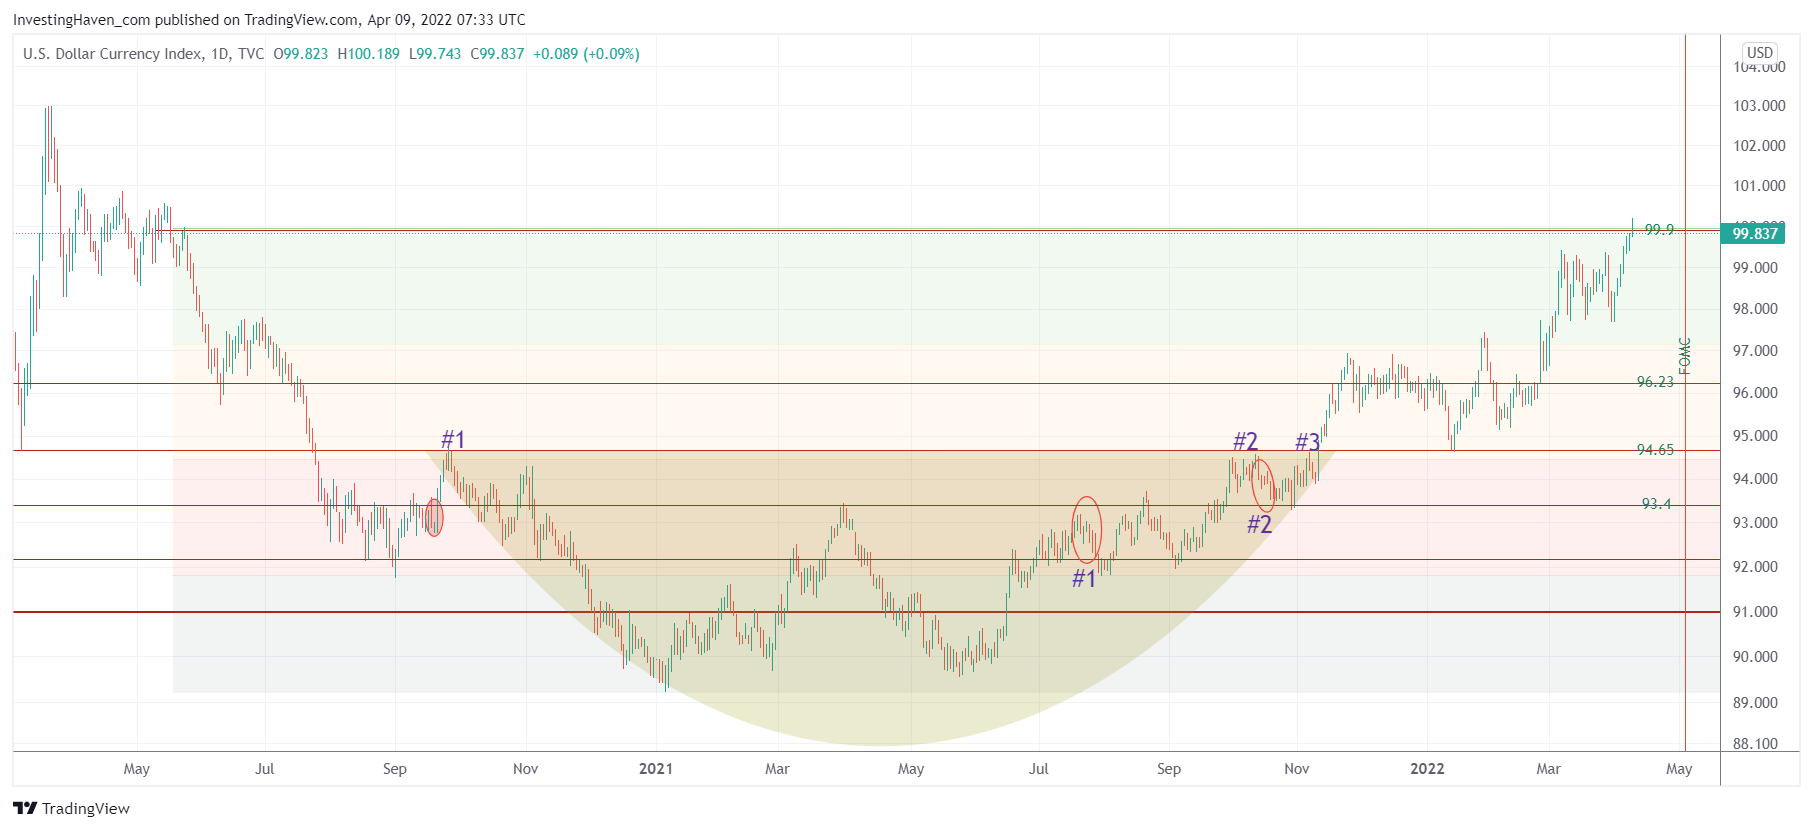
But this is the one and only chart that has prevented gold from trading at 2500 USD/oz: the USD.
As you can see, monetary tightening was visible in the USD chart, it started more than 14 months ago! At the same time, though, gold was improving was well (working through a bullish reversal). This is conflicting, right? It is, and that’s the reality of the current market: conflicting trends.
This implies that the narrative outlined above (tightening is bad for gold, the end of the war is bad for gold) comes with a very narrow view. In fact, it is an easy to sell narrative for media. The problem is that most investors just go with it… ending up being fooled.
Our viewpoint, since a long time, is that gold is working its way higher. It’s in the chart(s).
Moreover, the USD has been providing too much pushback.
Equally important, a set of conflicting trends has prevented gold to move higher.
But it’s about to happen, it’s a matter of time. Probably the most important thing is this: as gold is working its way higher, pushing to clear ATH, it will be silver that is going to be THE big investment opportunity in precious metals. For silver to go back to ATH it will need to double, and as Silver Has The Most Bullish Chart Setup In History Of Markets it probably won’t stop at former ATH.


