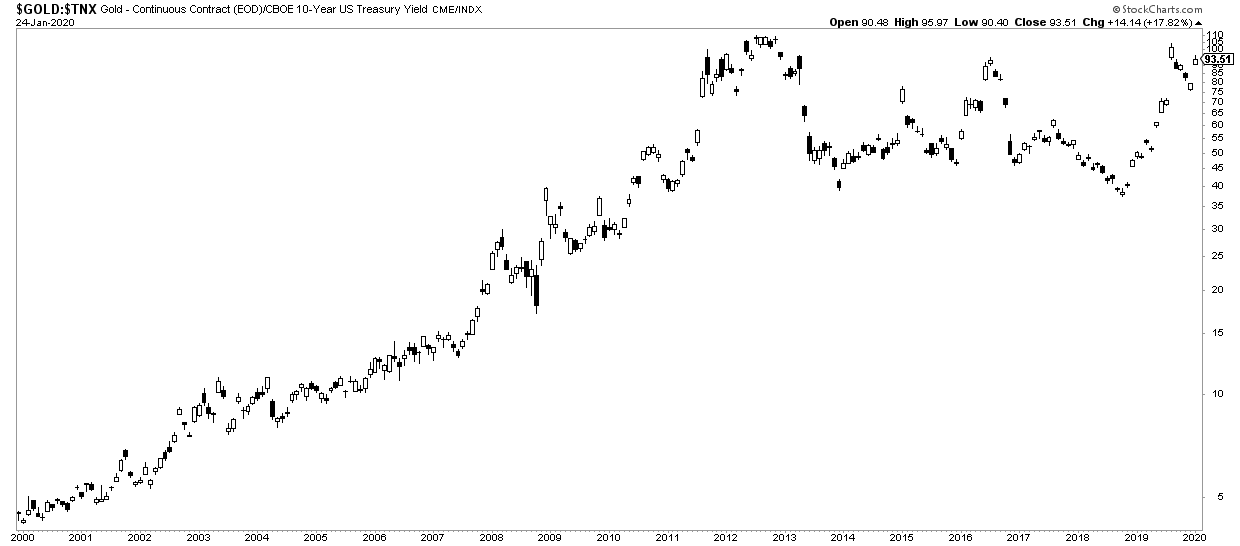
The gold market may be shaping up for opportunities. Wait a second didn’t we say the opposite just 2 weeks ago in our article Gold’s Uptrend Intact But May Need A Breather. Oh yes we did, and that’s what happened: the gold market took a breather. But we are also open minded to admit we cannot exactly how long gold needs a break, and we are also open minded to accept that the break may last “just” 2 weeks. As per our gold forecast for 2020 there is a new bull market in gold, and the gold to interest rates ratio may be confirming this epic trend change.
As discussed in Leading Risk Indicator Falls To Critical Level we believe January 2020 is characterized by an unusual level of volatility, especially in markets trying to find a direction. Bulls and bears were clearly not in synch, and that’s fine. The million dollar question is how to handle these situations?
This is a quote that is so crucially important (from that same article):
January 2020 was a great test for traders and investors. Those that like to put their ‘ego’ on the first place because “I told you so” or “I saw this last month so the trend must go in this or that direction” will see the results of that mindset in their P/L results sooner rather than later. January was and still is a challenging month, but those are the great opportunities to learn and improve trading/investing skills, as well as trading/investing methodologies.
If anything we saw gold being ultra bullish in the first days of January 2020, only turn pretty bearish in a few days time. We were fast enough to sell our silver holding with a small profit.
However, there is one ratio we often check to stay in synch with intermarket dynamics: the gold price change relative to interest rate changes.
Below is the chart we are talking about. Anything particular stands out on this chart?
Oh yes, a potentially big (BIG) breakout is coming. Remember, the rule of 3 is applicable on this chart as well: after 3 tests we may see a breakout.
What this really means is that gold may be rising faster relative to interest rate changes. In doing so it would confirm the continuation of its bull market.
We see opportunities arising in the gold space. After a short term trend change (seen with a few black candles at the right hand side of this chart, in January 2020) we get the message of the chart: don’t exclude a powerful bull market if this ratio decisively moves higher.


