Our bullish 2023 gold forecast is underway! We have covered gold and silver extensively in 2023, on our blog (high level insights) and in the premium services (with many more and detailed insights). Recently, we observed how gold’s leading indicator has a very bullish readings, among the most bullish readings historically. We mentioned that whenever gold registers a monthly closing price above 1989.62 USD/oz it will open the door to a rally to the 2200-2500 USD/area. We looked at multiple charts and indicators to conclude that gold is expected to move higher and set new all-time highs. With all that mind, let’s look at the question whether gold will set new all-time highs in 2024.
RELATED – Is Gold Expected To Set New All-Time Highs (ATH)?
The short version of our answer: YES, gold will print new all-time highs in 2024, presumably in the coming months, not later than the first quarter of 2024.
Here is why we think so.
We start with the gold price chart, an easy one to dissect:
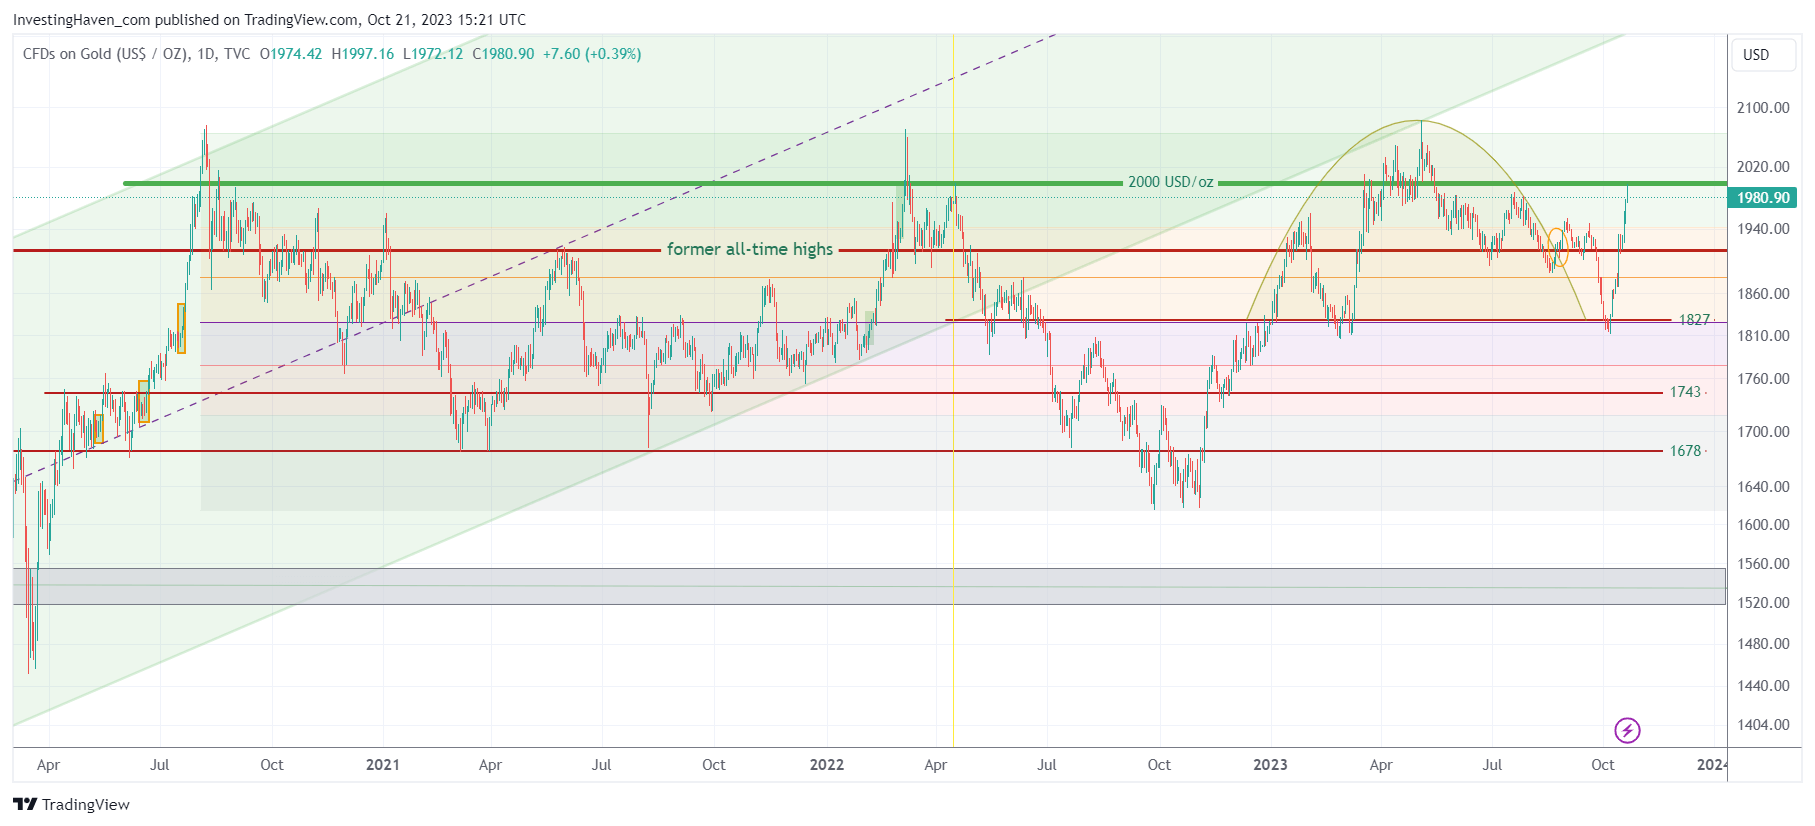
- Gold retraced, a few weeks ago, exactly to the 50% retracement level of its range connecting all-time highs with its 2022 lows. This is a powerful back-test, one that suggests a bullish intention and outcome.
- Gold has a triple top on its chart. Back in 2022, gold’s price moved from 1620 USD/oz to 2070 USD/oz, a wild rise. This time around, gold’s pullback went to test 1827 USD/oz, so a rally to 2070 USD/oz is not necessarily stretched, on the contrary even.
- When looking at this chart from the timeline’s axis, we see that the 2nd touch of 2070 USD/oz took approximately 20 months, the 3d touch some 12 months. The 4th touch is underway, visibly, it is 6 months ago ago that gold traded at 2070 USD/oz. The time intervals are getting shorter.
The daily gold price chart says it all. Gold is working on printing new all-time highs, most likely in the first quarter of 2024 (maybe even sooner).
Why do we think that gold is not going to find resistance at its all-time highs?
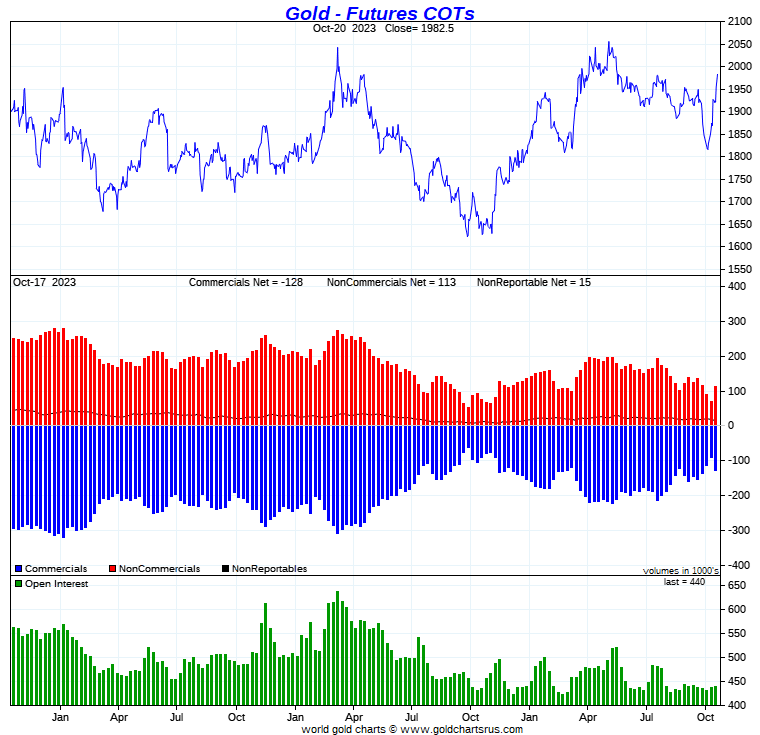
The answer is simple: its leading indicators are outrageously bullish, first and foremost positioning in the COMEX. The last gold CoT report (cut-off date: Tue, Oct 17th) shows how net short positions of commercial traders (blue bars, center pane) is nowhere near extreme levels. We call this report a ‘stretch indicator’: high net short positioning of commercials suggest there is not much upside potential, the opposite is true as well.
In other words, commercial traders (who are demonstrably able to cap prices through futures market positioning, particularly by influencing managed money participants) have plenty of shorting potential until they can cap prices from rising any further.
As a reference, readers should compare the net short positions of commercials in April (when gold was on the rise to hit 2070) vs. today. Back then, short positions were much higher as gold was approaching 2000 USD/oz.
The gold CoT report, combined with gold’s price chart, suggest that gold will set new all-time highs soon, not later than Q1/2024.
Needless to say, whenever gold confirms our thesis by printing new all-time highs it will be silver that will have the highest leverage. Silver is the only metal that did not test its 2011 highs, it is trading 50% below its 2011 highs. Silver will go back to 50 USD/oz, in 2024 most likely.
Follow our gold & silver detailed price analysis in which covering leading indicators of gold and silver prices. You’ll receive a detailed report every weekend. Premium Service: Gold & Silver Price Analysis >>


