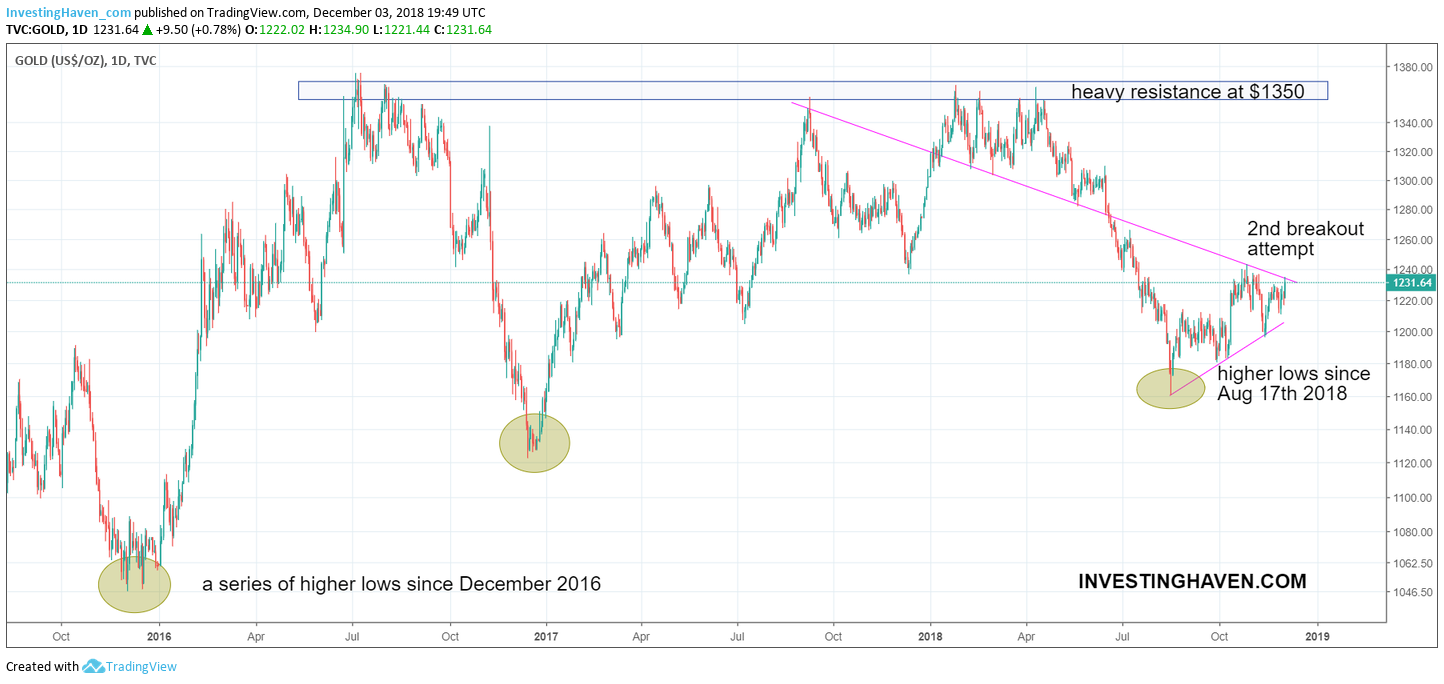
The gold price chart starts looking constructive again, and it might become very constructive very soon. A small push higher will lead to a breakout which will likely bring the price of gold at a minimum 10% higher. If this were to happen it would be in line with our gold price forecast 2019. This bullish setup is confirmed in our top 3 long term gold charts.
As a reminder let’s go back to our 2019 forecast for the price of gold (GOLD). This is what we wrote several months ago:
Below $1200 is bearish, we can hardly believe gold will stay below $1200. Between $1200 and $1275 is more or less neutral. Above $1275 is mildly bullish. Above $1375 is wildly bullish.
As part of our gold price forecast for 2019 we believe that gold is setting a major cup-and-handle on its chart. We believe that gold, in this formation, will go back up in 2019 to test the $1300 to $1375 area. As that will be the 3d attempt for gold to break out of its strong resistance (red line on the chart) there is a fair chance gold will succeed.
That’s why our most bullish gold price forecast for 2019 is that gold will hit $1550 in 2019 (20% probability), but only if it succeeds breaking through the $1375. The $1375 test is a base case scenario (75% probability).
As always we get all sorts of ‘reasons’ served by financial mainstream media on why the price of gold jumped today.
The the underlying rationale for our forecast was a combination of leading factors, way outside the day-to-day noise of news. First, we looked at the gold futures market which reached extremes. Historically, this has always resolved to the upside. Second, the Euro seemed to be stabilizing around mid-term support which is supportive for gold prices.
From a chart perspective we see the evolution of the above leading indicators reflected. And gold’s chart starts to look increasingly constructive.
The bottom of August 17th marked a short lived low with a quick recovery. As per our forecast the price of gold did not trade structurally below $1200 which was a bullish factor as outlined. With this, we did set a series of higher lows in the last 24 months as seen on the chart.
A small push higher and gold is breaking out. If this materializes we expect gold to move to $1350 pretty fast. That’s where the magic 3d test to break out will take place, so that’s where it will become really (really) interesting. We expect this to happen in the next 3 months.


