Investing Haven
No Result
View All Result
Gold Silver Investing >>
CRYPTO INVESTING >>
  • 2025 Forecasts
    • 10 market predictions
    • Dow Jones forecast
    • S&P 500 forecast 2025
    • Nasdaq prediction 2025
    • Best altcoins to buy
    • Best crypto to buy now
    • Which crypto will explode
    • 15 crypto forecasts 2025
    • Which precious metal to buy
  • Silver
    • Silver prediction 2025 – 2030
    • Will silver exceed $30?
    • When will silver hit $50?
    • Can silver hit $100?
    • Silver shortage
    • 50-year silver chart
    • Silver bullish reversal
    • Silver seasonality charts
    • How to invest in silver
  • Gold
    • Gold prediction 2025 – 2030
    • Will gold set new ATH?
    • Will gold hit $3,000?
    • Can gold hit $10,000?
    • Gold chart 10 years
    • Gold chart 50 years
    • Gold chart 100 years
    • Gold silver ratio
    • Gold seasonality charts
  • Commodities
    • Coffee forecasts
    • Sugar forecasts
    • Nickel forecasts
    • Lithium investing
  • Crypto forecasts
    • BTC prediction 2025 – 2030
    • ETH prediction 2025 – 2030
    • SOL prediction 2025 – 2030
    • XRP prediction 2025 – 2030
    • XLM prediction 2025 – 2030
    • BNB prediction 2025 – 2030
    • ADA prediction 2025 – 2030
    • AVAX prediction 2025 – 2030
    • KAS prediction 2025 – 2030
    • NEAR prediction 2025 – 2030
    • BCH prediction 2025 – 2030
    • LINK prediction 2025 – 2030
    • DOT prediction 2025 – 2030
    • SUI prediction 2025 – 2030
    • ICP prediction 2025 – 2030
    • LTC prediction 2025 – 2026
    • STX prediction 2025 – 2030
    • DOGE prediction 2025 – 2030
    • SHIB prediction 2025 – 2030
    • PEPE prediction 2025 – 2030
    • FLOKI prediction 2025 – 2030
    • WIF prediction 2025 – 2030
    • ONDO prediction 2025 – 2030
  • News
    • Crypto news
    • Commodities
  • Login
Investing Haven
No Result
View All Result

Home » Commodities & Gold » An Exceptional Gold Price Historic Chart on 40 Years

An Exceptional Gold Price Historic Chart on 40 Years

Taki T. by Taki T.
February 1, 2019
in Commodities & Gold
gold forecast
3.8k
VIEWS
Share on FacebookShare on Twitter

Long term gold charts are crucial because they show dominant trends. The gold price chart on 40 years is the one with the most historic data. It reveals an exceptional pattern not seen on any other historic gold price chart: a historic rising channel with several subchannels which can help us in forecasting gold price. It confirms our gold price forecast 2019.

Most investors tend to forget the importance of long term charts. It is so easy to get caught up in the endless stream of gold price news. Not that we consider this to be the reference but just as an illustration we refer to this gold news stream or simply the Google gold price feed.

The big problem with short term gold (GOLD) price analysis as well as short term oriented gold news is that it distracts from what really matters, i.e. dominant gold price trends.

When it comes to gold we would argue that the most dominant trend is visible on the historic 40 years gold price chart.

The importance of any gold price historic chart

It is crucial to always take a top down approach, in any market and for any investment. That’s because the most dominant trends are visible on historic charts. These dominant trends influence both long and short term trends.

In the ideal world the longer term charts confirm the shorter term charts. So say that the gold price historic chart on 40 years shows a pattern in which the gold price is moving, and there is a similar conclusion from the 10 year and 2 year gold price chart it would classify as a ‘confirmation’ of the different time frames. That’s re-assuring.

The opposite is true as well, and here it becomes interesting. IF the gold price historic chart on 40 years suggests that the gold price is heading into secular resistance but the 2 year chart shows a totally different picture then we talk about ‘divergence’. This is always tricky, as time frames are not aligned. In such a scenario we prefer to give the market time to show a direction.

Our point here is that it is imperative for gold investors to spend sufficient time analyzing the chart structures on the long term historic gold price charts combined with the shorter term time frames. Ultimately, it pays off in your gold investments.

Gold price historic chart on 40 years

Why do we consider the gold price historic chart on 40 years so important?

In other words why do we consider the gold price historic chart on 40 years more important than the 80 years chart or the 10 years chart?

There is a specific reason for this. And it is visible on the chart itself.

First, market-wise, the gold price started trading ‘freely’ with an open market in 1971, on August 15th. That’s when President Nixon took the U.S. off the gold standard. So any historic gold price chart should be after that date, as before it was not really relevant.

Second, chart-wise, the major peak of the gold price was set in 1980, and the longest consolidation in gold’s history. A fact that is kept secret by chartists is that rising channels which are the most dominant trends have their roots in major peaks and subsequent consolidations.

If we apply all this to the gold market it is clear that any gold chart after 1971 should be taken seriously. But between 1971 and 1977 there was not such a relevant price action. It all started in 1978.

You see why we choose the gold price historic chart on 40 years as the most relevant showing dominant trends?

Dominant trends on the 40 years gold price chart

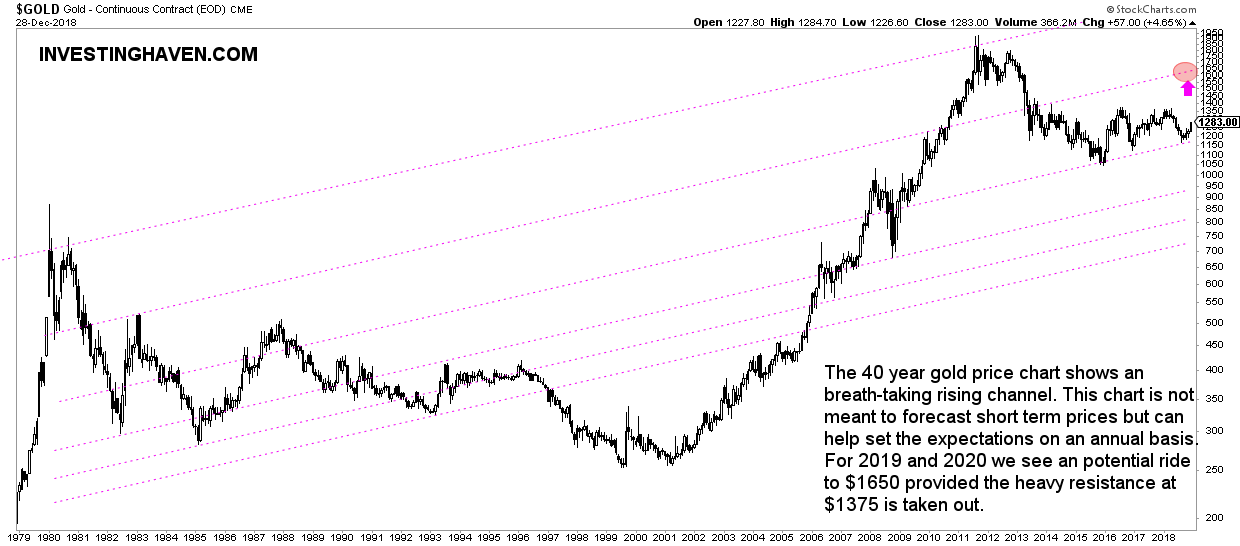
Below is the gold price historic chart on 40 years.

What is truly exceptional is the rising channel which is really not visible to many. It requires some digging and analysis in order to identify it.

Take for instance the peak of 1982. Who could imagine that it has value at the present day? Look how this 1982 peak created a subchannel which provided support since 2016, during the heavy gold bear market as it marked the ultimate low of this bear market.

What this 40 year gold price chart learns for 2019 and 2020 is that there is a fair chance that gold’s price will rise to the top of this channel provided that 1200 holds strong as a monthly close. That’s also what we have been repeating recently: the importance of $1200.

As gold is getting a bid now we expect gold to rise to $1650 at a certain point where it will meet heavy resistance. This might happen in 2019 already but, for this, we need the lower timeframes.

Now this is exactly how to read long term charts: determine the ultra-important price points when it comes to dominant trends but zoom in to see how the market reacts on those important price levels.

gold price chart 40 years history

10-YEAR ANNIVERSARY OFFER: InvestingHaven.com celebrates 10 years. Temporarily, you can enjoy a discount on our premium gold/silver and crypto reports. Or you can become a VIP member. Go to our anniversary deals >>
Receive our weekly newsletter.

premium service SP-500 premium service trade alerts premium service crypto teaser 

No related posts.

Tags: GOLD
Taki T.

Taki T.

Taki is a chart analyst who is passionate about unlocking unique insights out the chart. While the vast majority of analysts remain focused on price analysis, Taki starts with timeline analysis and adds price analysis to this. In doing so, he developed a unique methodology to find opportunities in financial markets, across assets and markets.

Connect with InvestingHaven

Receive top notch forecasts for free.

*We hate spam as you do.

Site Navigation

  • RSS Feed
  • About us
  • Advertising
  • Sponsored Content Policy
  • Mission 2026
  • Sitemap
  • Privacy & Disclaimer
  • Terms of Service
  • Contact Us
investing haven logo

Precious metals market analysis including gold and silver price predictions. Crypto market analysis including highly accurate BTC ETH SOL XRP forecasts.

Copyright © 2025 InvestingHaven

Login to your account below

Forgotten Password?

Fill the forms bellow to register

All fields are required. Log In

Retrieve your password

Please enter your username or email address to reset your password.

Log In

Receive top notch forecasts for free.

*We hate spam as you do.

No Result
View All Result
  • News
  • 2025 Forecasts
    • 10 market predictions
    • Dow Jones forecast 2025
    • S&P 500 forecast 2025
    • Nasdaq prediction 2025
    • Best crypto to buy now
    • Which crypto will explode
    • Best altcoins to buy
    • 15 crypto forecasts 2025
    • Which precious metal to buy
  • Silver articles
    • Silver prediction 2025 – 2030
    • Will silver exceed $30?
    • When will silver hit $50?
    • Can silver hit $100?
    • Silver shortage
    • 50-year silver chart
    • Silver bullish reversal
    • Silver seasonality charts
    • How to invest in silver
  • Gold
    • Gold prediction 2025 – 2030
    • Will gold set new ATH?
    • Will gold hit $3,000?
    • Can gold hit $10,000?
    • Gold chart 10 years
    • Gold chart 50 years
    • Gold chart 100 years
    • Gold silver ratio
    • Gold seasonality charts
  • Commodities
    • Sugar forecasts
    • Coffee forecasts
    • Nickel forecasts
    • Lithium investing
  • Crypto news
  • Crypto forecasts
    • BTC prediction 2025 – 2030
    • ETH prediction 2025 – 2030
    • SOL prediction 2025 – 2030
    • XRP prediction 2025 – 2030
    • XLM prediction 2025 – 2030
    • BNB prediction 2025 – 2030
    • ADA prediction 2025 – 2030
    • AVAX prediction 2025 – 2030
    • KAS prediction 2025 – 2030
    • NEAR prediction 2025 – 2030
    • BCH prediction 2025 – 2030
    • LINK prediction 2025 – 2030
    • DOT prediction 2025 – 2030
    • SUI prediction 2025 – 2030
    • ICP prediction 2025 – 2030
    • LTC prediction 2025 – 2026
    • STX prediction 2025 – 2030
    • DOGE prediction 2025 – 2030
    • SHIB prediction 2025 – 2030
    • PEPE prediction 2025 – 2030
    • FLOKI prediction 2025 – 2030
    • WIF prediction 2025 – 2030
    • ONDO prediction 2025 – 2030
  • Premium Crypto Alerts
  • Premium services

Copyright © 2025 InvestingHaven