The gold market is hot, the gold market sells off. Repeat this short term cycle a few times, and you have a great recipe to turn gold investors absolutely nuts. That’s what’s happening right now in the gold market, and a few gold charts visualize this story. As per our short term oriented gold forecast we believe that the gold price will turn bullish or bearish during election week. Consequently, silver will follow the same path, and our short term oriented silver forecast is absolutely similar to the short term gold forecast. What does this mean for gold stocks? Indeed, they also need a few more weeks to decide on a direction, no surprise, right.
The gold stocks chart we track for the entire precious metals universe is the GDX ETF.
And we are going to guide you through our way of thinking, our way of charting, our way of reading markets. This is just a glimpse of the work we do, there is so much more in our research work. But in the next 2 charts you will find some good clues on the research mechanics when it comes to reading markets.
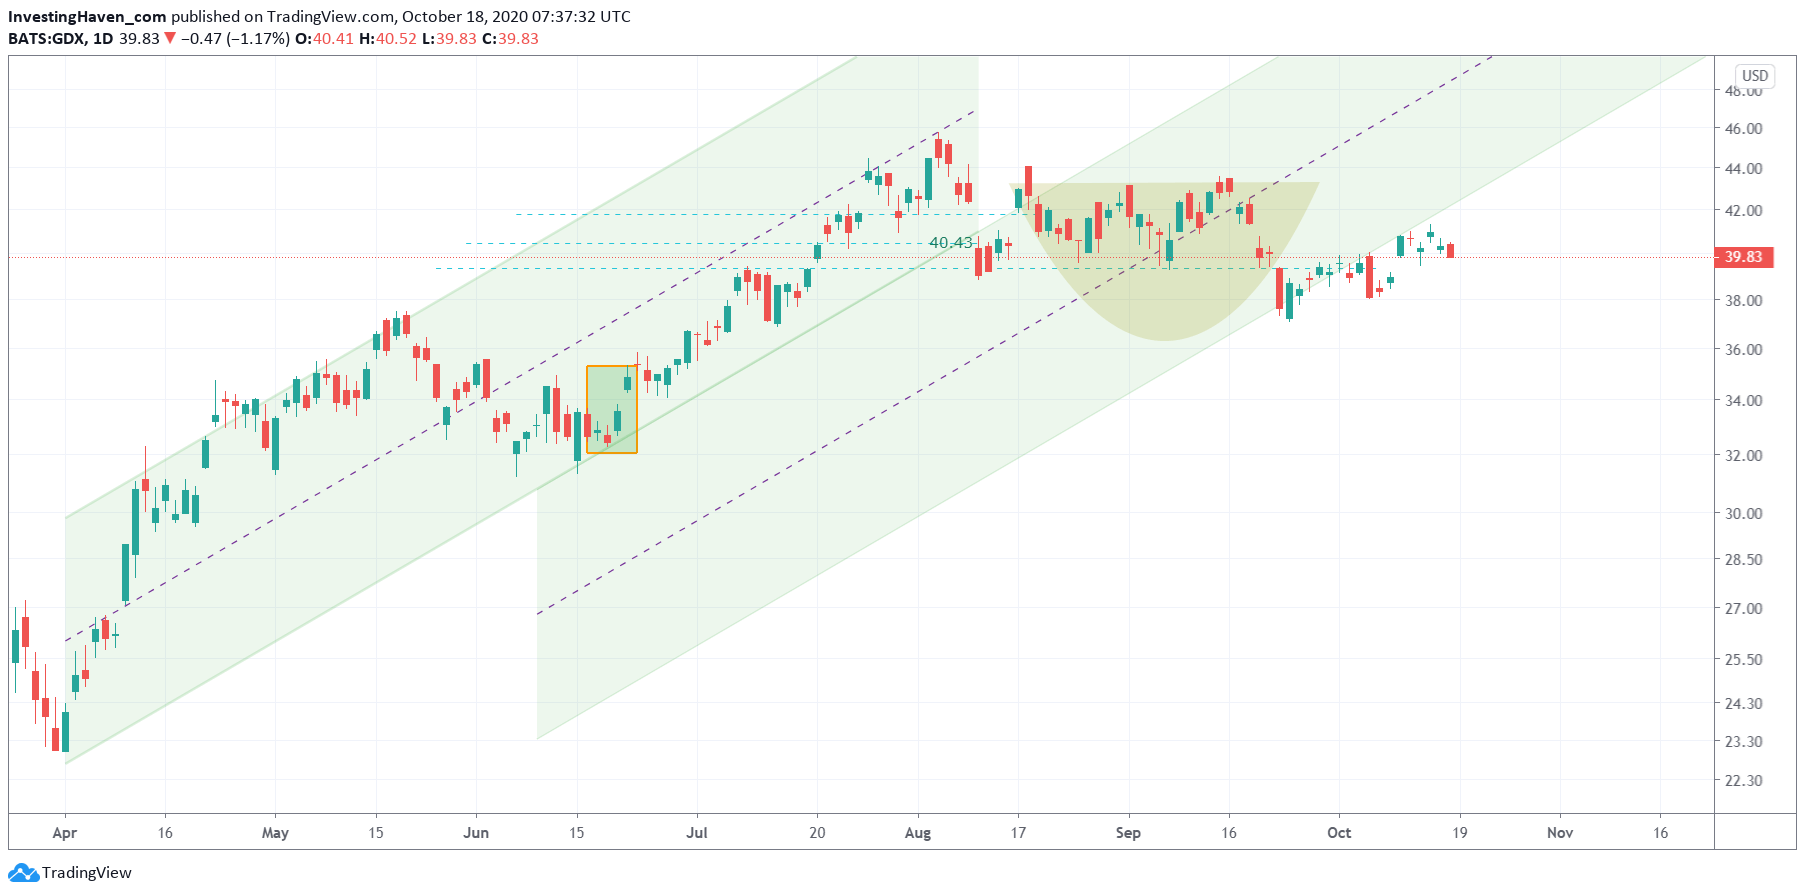
The GDX chart, represening the larger gold and silver miners, is embedded below.
The annotations are ours, and they indicate a few things:
- The uptrend of April/May slowed down mid-May.
- The uptrend continued in June/July, though at a slowe rate.
- Since the first week of August, there is no uptrend, only a sideways trend. This implies that the uptrend is slowing down even more, and that’s reflected in the GDX moving to the parallel channels (green background on below chart).
- In August there was a sideways trend, and it could have qualified as a bullish reversal (yellow rounded pattern). This bullish outcome was invalidated mid-September.
- Since the first week of October, the GDX ETF fell below the 2nd rising channel, and it is now for 4 full days below it, hanging ‘somewhere’ without a structure.
What do you make out of all this now, going forward? How can you reasonably use the current situation to inform an investing decision?
The answer is simple: keep on looking for the most reasonable next pattern.
And that’s what we constantly do at InvestingHaven: we try to project the future based on ongoing trends. That’s also how we want to turn 10k into 1M in 7 years, which is what our Mission 2026 is all about. And we are succeeding in it, unbelievable but ture.
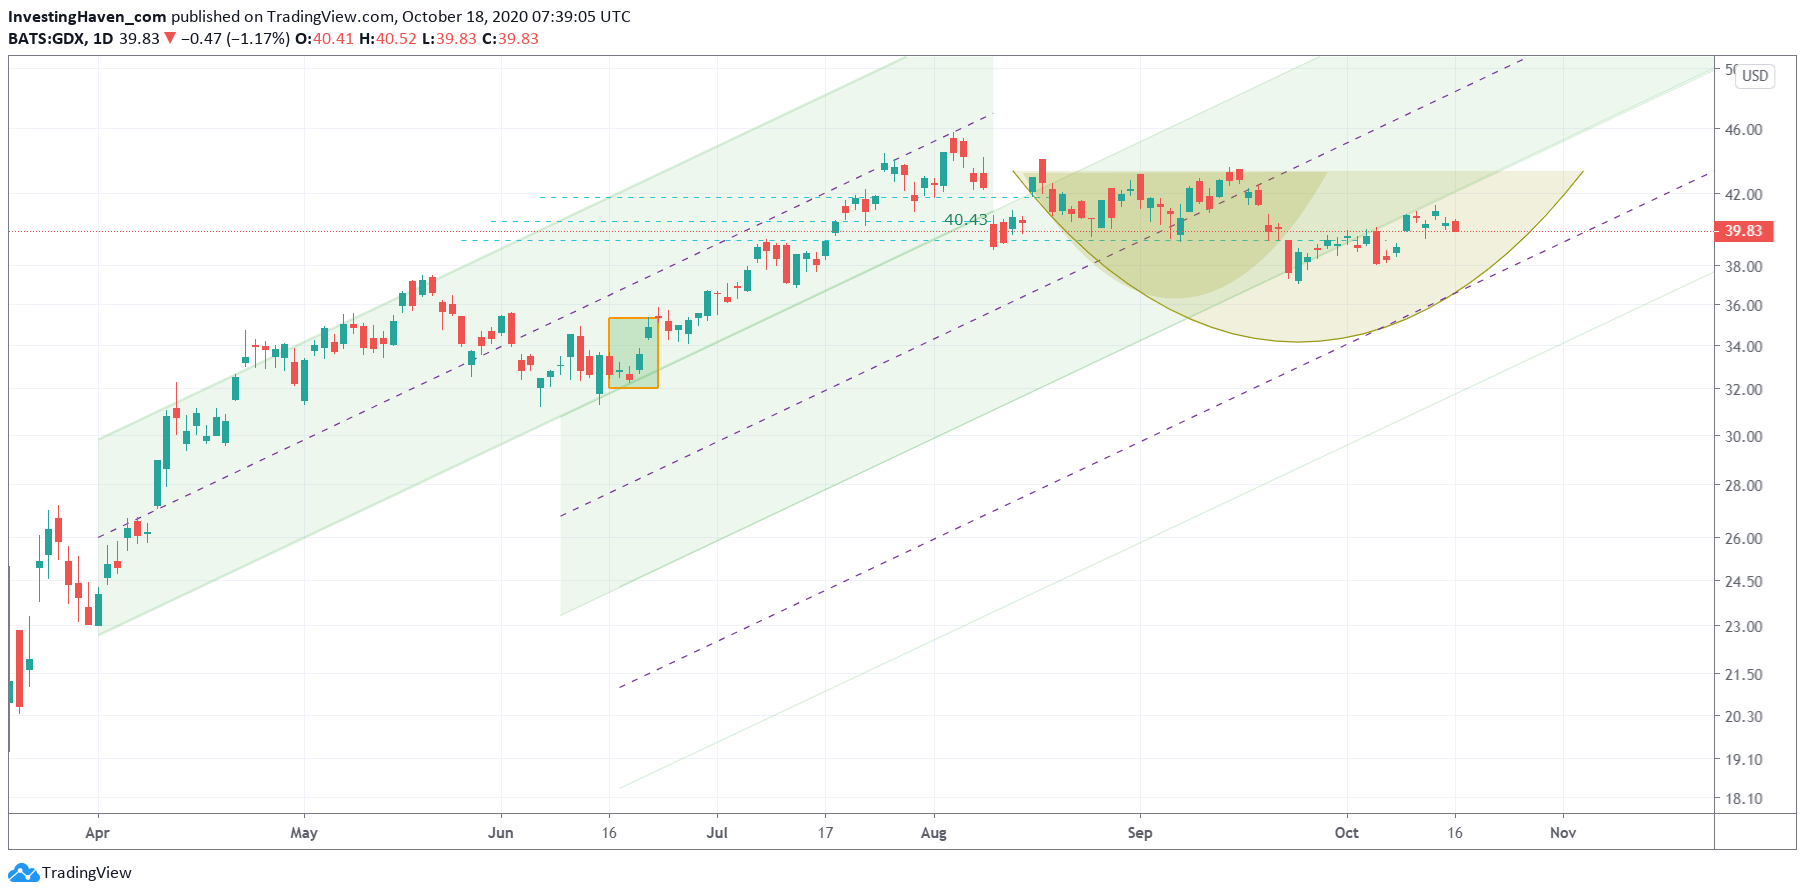
What GDX might be doing is pretty simple:
- It is moving sideways in what is becoming a 3d rising channel since the April uptrend started. By exclusion, there is no downtrend visible, so sideways and/or uptrend is the only outcome possible as per the current data set.
- Consequently, a bullish reversal is what we can reasonably expect is the ongoing dominant pattern. That’s what we did raw with the light yellow rounded pattern.
- Whether this bullish reversal will end at the dotted median line, or whether it will run until the support level of this new (3d) rising channel, will be determined by the gold price.
- That’s why an ultra precise gold price forecast is imperative, and that’s what we shared in our article mentioned in the intro.
In other words, as per these few charts, we do know that the position of below GDX chart combined with the gold price chart in the first week of November will inform our gold related investing decisions.
Between now and then, we can reasonably expect gold stocks to remain in ‘la-la-land’, in the absence of a decision on a new stimulus package.


