Gold is fast approaching the 2,000 USD/oz level. It’s very simple: once 2k is cleared, an epic bull run will start. Our gold price forecast 2023 might be achieved and exceeded! If so, more importantly, our silver forecast will be crushed, absolutely crushed, still in 2023!
Last week, in Fear Rising, Why Gold & Silver Will Obviously Benefit From This, we wrote “once gold has cleared 2000 USD/oz it will start a journey based on by intrinsic drivers. For now, it still needs an external driver which is the combination of the USD and Treasuries.”
About a month ago, we wrote Gold Has A Beautiful Chart:
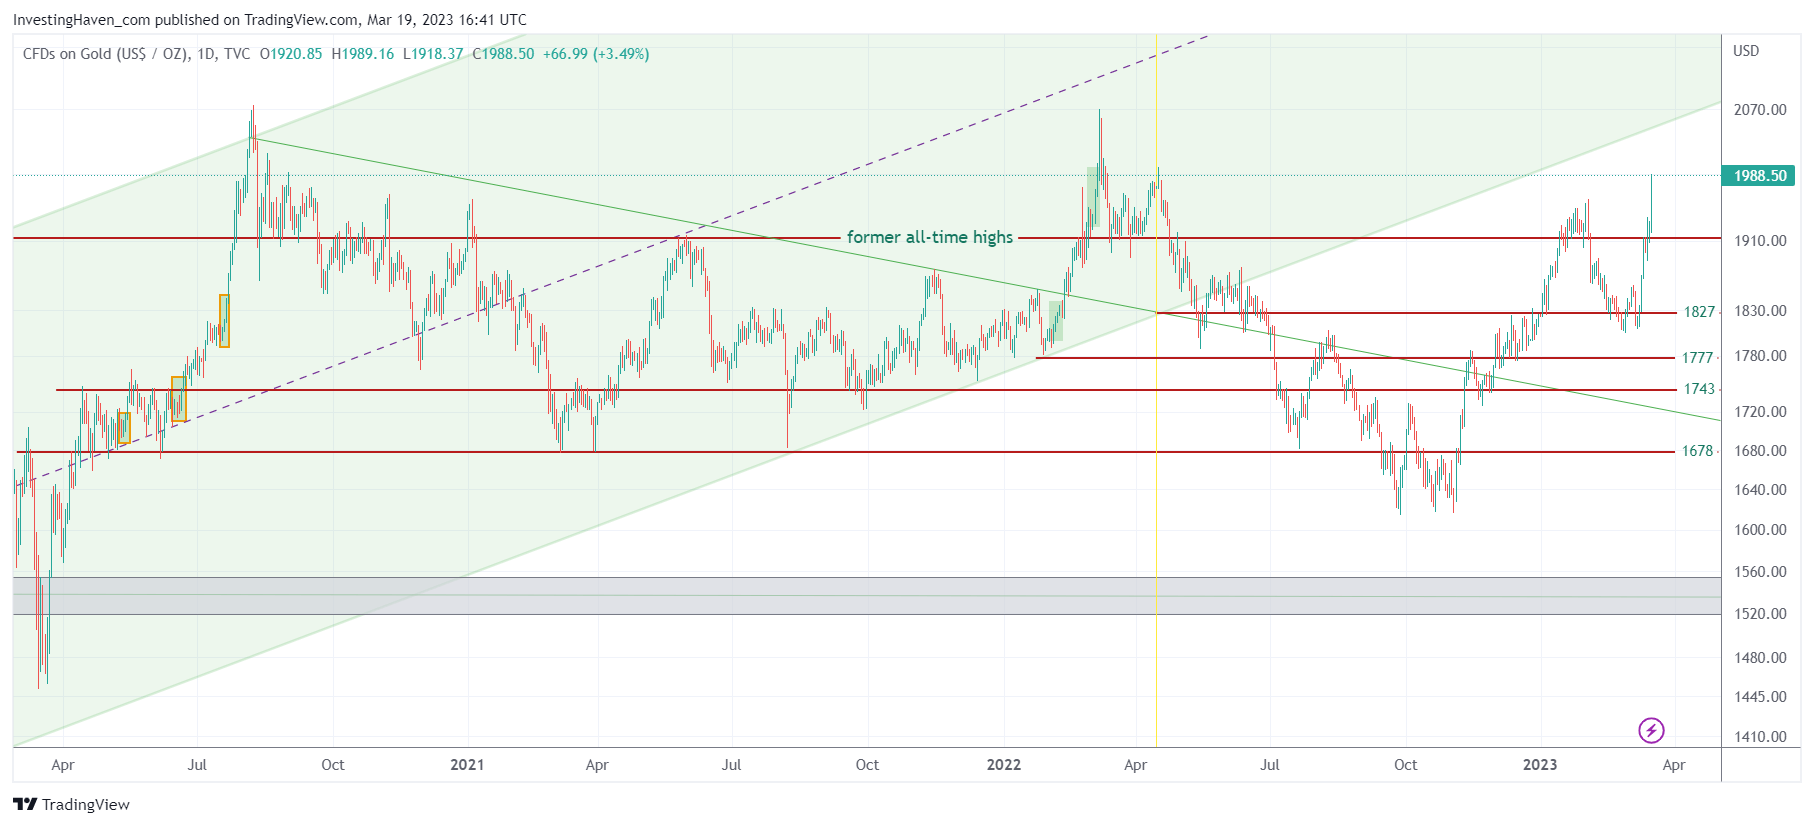
That’s what we continue to see: a nice consolidation in the context of what is becoming a giant consolidation, the one that started in Sept of 2020. So, when your eye is focused on the long consolidation, as seen on below chart, the gold chart turns beautiful. We’ll stick to that beautiful view, it will invalidate if and when gold falls below 1678 USD/oz for more than 5 consecutive days.
Now, if you combine both quotes and map them to the (beautiful) gold chart (below), you can see what’s happening:
- A double W reversal is now complete.
- Support levels did hold, especially 1777.
The consolidation is powerful.
The one and only thing to pay attention to is that the channel (green shaded area) might provide resistance. Interestingly, the rising channel coincided with 2,000 USD/oz right now. So, in a way, 2k might be double resistance: it’s a strong rounded number and channel resistance).
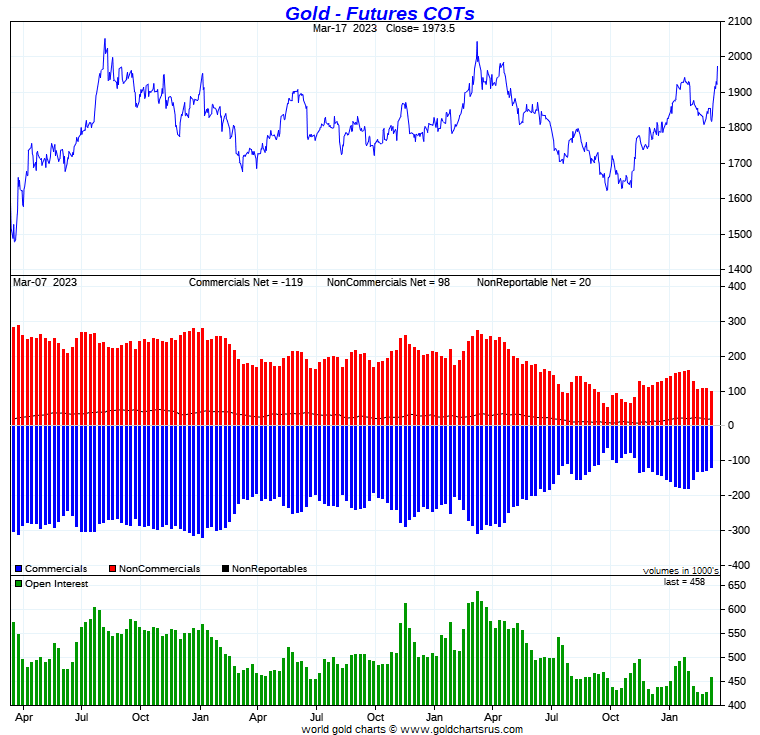
We believe that 2k might provide resistance, but only in the short run. That’s because the gold futures CoT positions are strongly bullish. If anything, the CoT report is THE leading indicator, for gold and silver.
Note that we were very bullish silver, but are now turning extremely bullish silver! In our Momentum Investing service we are featuring our top silver mining stocks, in an alert that will be shared with premium members not later than this coming Wednesday.


