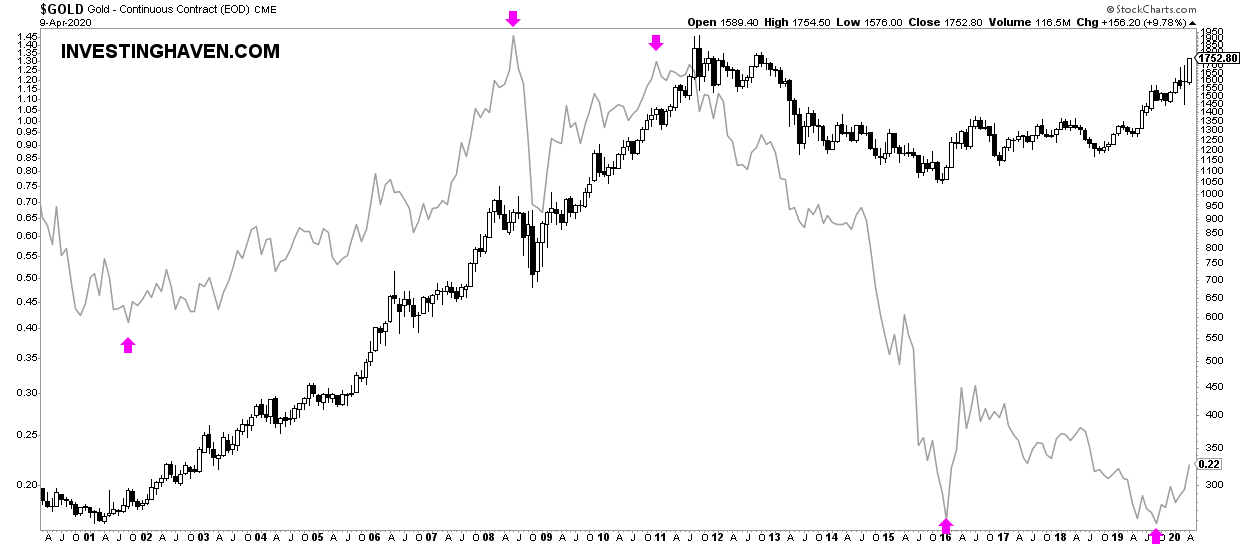
If anything gold is known to track inflationary pressure. When deflation was winning over inflation, between 2013 and 2015, gold literally crashed to 7-year lows. However, the long term inflation/deflation trend shows a beautiful setup, and gold (as usual) as a leading indicator was fast to react on this potential new uptrend in inflation. Our gold forecast is about to reach our 2021 target.
As said this is one of the 15 must-see gold charts as part of the gold chartbook shared with our Momentum Investing members. The gold chartbook looks at the gold market from multiple angles, and concludes with a clear outcome on which precious metals segment is most attractive today as a momentum play.
What this particular chart shows us is the long term trend in both gold (dark candlesticks) and inflation/deflation (light grey).
The inflation/deflation indicator (courtesy of Martin Pring) shows 3 major turning points: one in 2001, one in 2008/2011, and the last one in 2016/2019.
Guess what, gold is faster to rise once inflationary pressures win (2001 + 2019), but it is slower to fall when deflationary pressure win (2013).
When looking at gold as it relates to inflation/deflation this chart setup makes so much sense, and confirms both gold’s uptrend starting last June (when we flashed a major buy alert on a silver miner that made us 70 pct). But it also confirms the double bottom of 2016/2019.
Yes, inflation is about rise.
Yes, gold was already signaling this almost a year ago when we became very bullish on gold.
We saw a buy signal on a few gold plays and gold segments earlier this week.


