Platinum surged 28% in June amid supply deficits and rising demand, but technical overextension signals a possible short-term pullback.
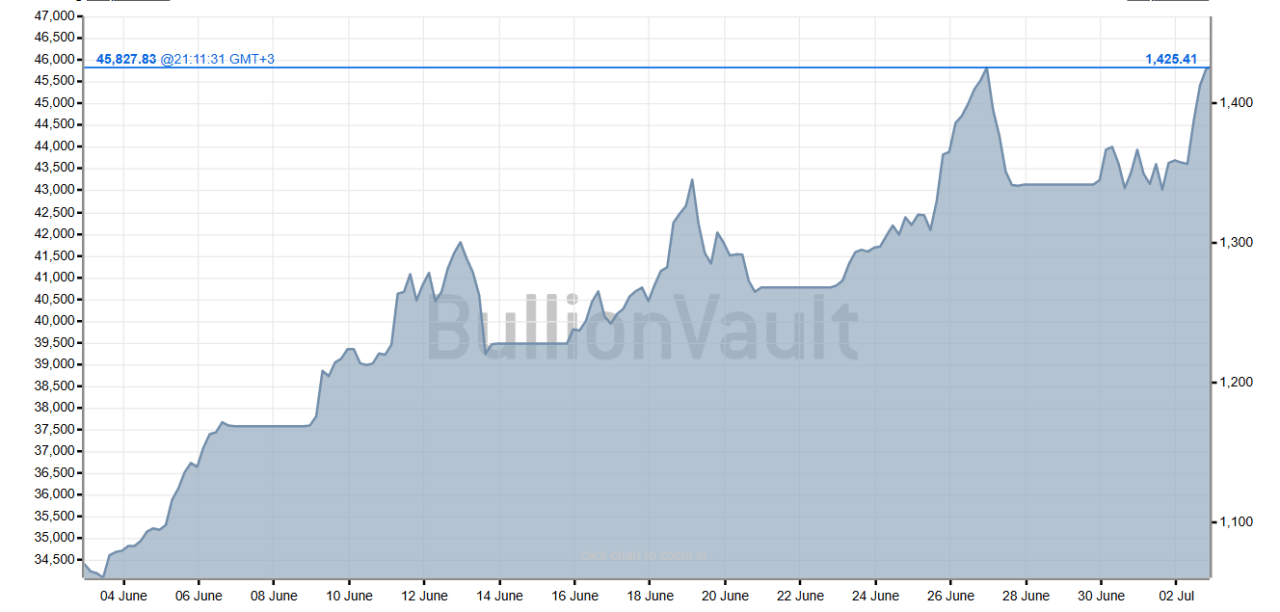
In June 2025, platinum prices surged 27–28%, hitting around $1,415/oz—a peak unseen since 2014— thanks to persistent supply deficits and a wave of “gold fatigue” among investors. That dramatic movement poses a key question: is this the start of a new bull trend or merely a climax signaling a sharp reversal?
Sky‑High Charts & Shifting Sentiment
Technical indicators suggest a potential pullback. Platinum now trades 30% above its 50‑day moving average, a rare event previously seen in early 2008—just before a roughly 40% plunge.
Meanwhile, the futures curve sits in contango, with April and October 2026 contracts priced above the spot, hinting at eased immediate supply pressure.
Investor positioning also raises caution: net‑long futures among non‑commercial traders dropped by around 3,700 contracts in a week to 23,227, indicating a possible blow‑off scenario.
Demand Boom Meets Tight Supply
Fundamentally, platinum faces a structural supply squeeze. The World Platinum Investment Council estimates deficits near 966k oz in 2025—after a 992k oz shortfall in 2024—and expects this imbalance to persist through 2029. Mining complications in South Africa (output down ~12–13%) and weak recycling are key drivers.
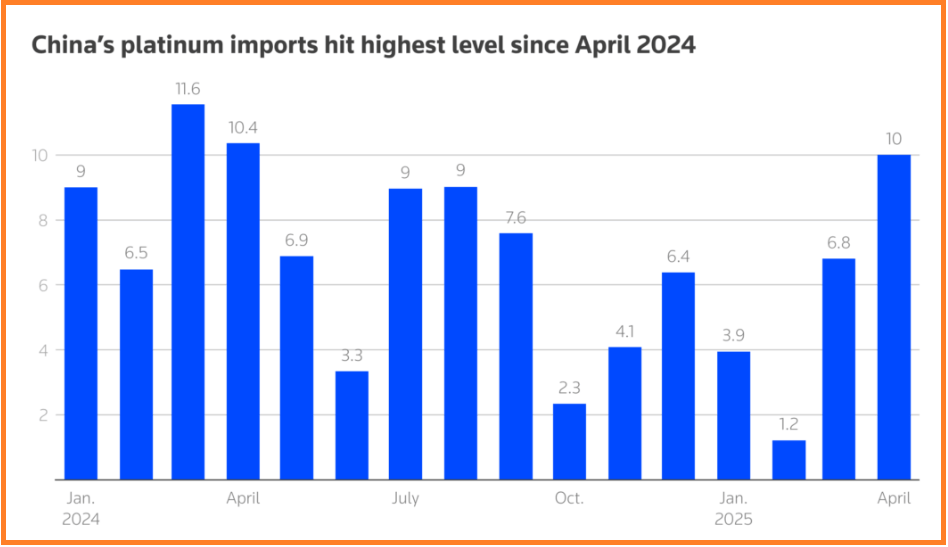
Demand has surged: Chinese jewelry fabrication rose ~26% in Q1 2025, supported by a gold-to‑platinum ratio near 3.5×—its highest since 2015.
At the same time, industrial demand—including catalytic converters and hydrogen applications—continues to expand.
The Path Ahead
The near-term picture points to a cooling-off phase, with profit-takers potentially driving a retreat back toward $1,250–1,300/oz. But if platinum holds above the $1,225/oz pivot, technical strength and structural deficits support a push into the $1,400–1,500+ range by year-end.
Some bullish forecasts even stretch into $1,600–1,800, should green-energy and industrial momentum intensify.
Conclusion
The platinum paradox remains: on one hand, deepening deficits and expanding demand paint a compelling bullish narrative; on the other, technical overextension and speculative positioning warn of a pullback.
Investors should watch the $1,300 support zone—a dip there may present an ideal entry point. A breach below $1,225 could signal a deeper correction, while sustained strength above $1,400 would cement the case for continued upside.
Our most recent alerts – instantly accessible
- Quarterly Gold & Silver Charts Are In, Here’s the Big Picture (June 29)
- Gold & Silver – The Big Picture Charts That Matter (June 21)
- Gold & Silver Shine but Not Simultaneously… The Market Loves To Confuse Investors (June 15)
- Silver On Its Way To 50 USD/oz (June 8)
- Precious Metals: The Long-Term Outlook Looks Profitable, Here Is Why (May 31)


