It is exactly 4 weeks ago when ‘some traders’ started to attack the gold and silver price in the futures market, on Sunday evening. This created a flash crash in both gold and silver. Fast forward to today we see an immensely bullish setup especially on the silver chart. Yes, our silver forecast for 2021 is still in play, it is a matter of WHEN, not IF, the price of silver will be trading in the higher 30ies.
Let’s summarize what we wrote in the public domain in the month of August when it comes to silver. Note that premium members receive much more detailed analysis, and we also make it actionable for premium members (read: entry and exit prices in specific markets).
Silver: A ‘Mysterious’ Rise In Open Interest Right After The Flash Crash From Sunday 08/08 (Aug 15th, 2021):
There is an even more interesting conclusion from the above chart: open interest, in green, in the lower pane, increased since Tuesday 08/10/2021 (which was the cut off date of this report).
So silver sold off on Sunday night, 08/08/2021, in the futures market. And ‘at the same time’ open interest in silver (futures market) did rise.
The way we understand this: some really big and influential market participants added big numbers of futures contracts, in the silver futures market.
Silver Still Long Term Bullish, Chart And CoT Still Aligned (Aug 22nd, 2021):
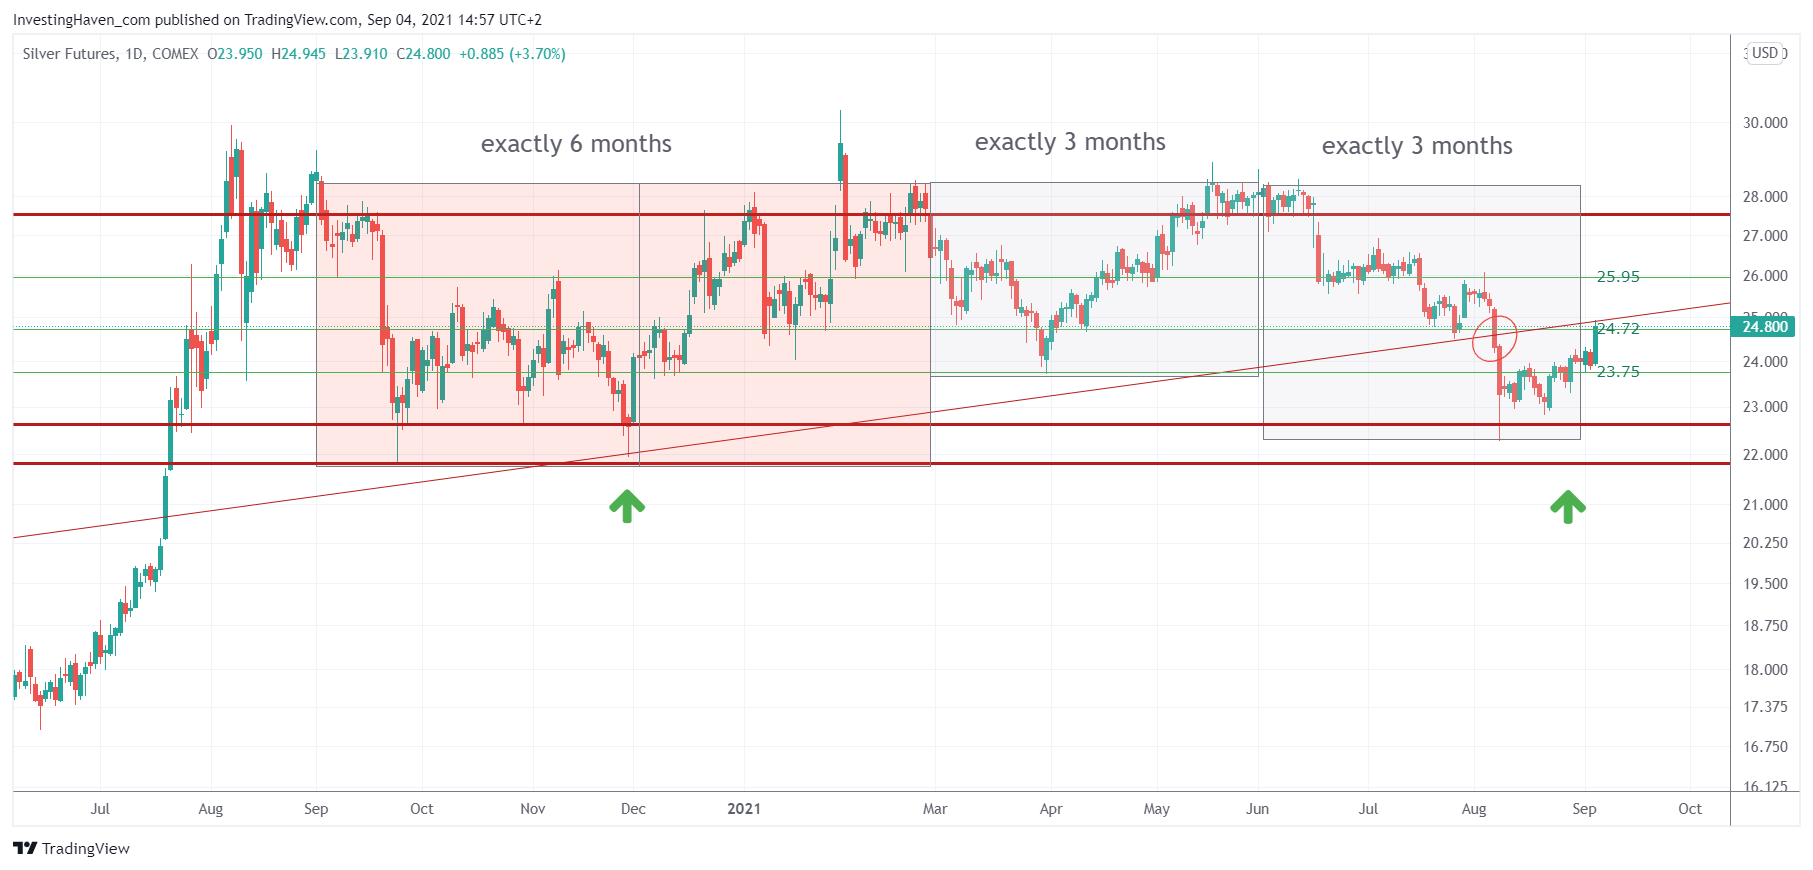
Provided that silver respects key levels, particularly the lows of this 12 month consolidation, the market should give us an important insight on August 31st: did silver print another bottom near 23 USD/oz? If so we can reasonably expect price to move up in the next 3 month cycle.
Silver Forecast: Bull Run Is Completing Its Warming Up, Preparing Its Sprint (Aug 29th, 2021):
“Silver, oh silver, when will you do your magic?” is what many are asking. If silver would be able to answer this question it would undoubtedly say “very soon“, and it would add “why don’t you relax, I’ll do the work, you don’t have to work“.
We continued:
The daily price chart with the 3 month cycles shows a successful test of the 23 – 24 area. Against last September-December this is a higher low (the two lowest red trendlines were not hit on a daily closing basis), clearly, and that’s is strongly bullish for the long term. Strongly bullish!
The silver price chart says it all:
- From a price perspective An immensely bullish setup after a confirmed giant W reversal (2nd ‘bottom’ was printed on August 8th).
- From a cycle perspective: The start of a 3 month cycle (last week) comes right after a 3 month cycle in which a crucial local bottom was set.
- From a forecasting perspective: First stop at 28 USD.
An even more bullish structure is what we got now on the silver chart. The longer a consolidation goes up the more powerful once it resolves. Silver is absolutely, phenomenally powerful.


