Our silver price forecast 2019 is underway, and we got a confirmation today. The silver price breakout is happening which implies that our silver stocks forecast for 2019 will materialize as well at a certain point. Look at these beautiful silver charts, they clearly confirm the breakout in silver is suggesting a bullish 2019, for sure a bullish first part of 2019!
Let’s do a very basic approach: review the lower timeframe before doing the higher timeframe.
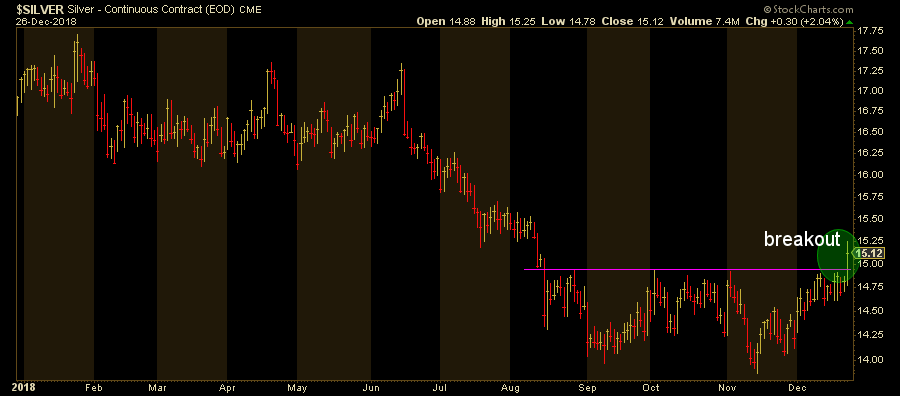
The daily chart shows the breakout of the silver price. After a consolidation of 5 months it has become a rounding bottom. The price of silver is now breaking out of this consolidation area which is essentially what a rounding bottom stands for.
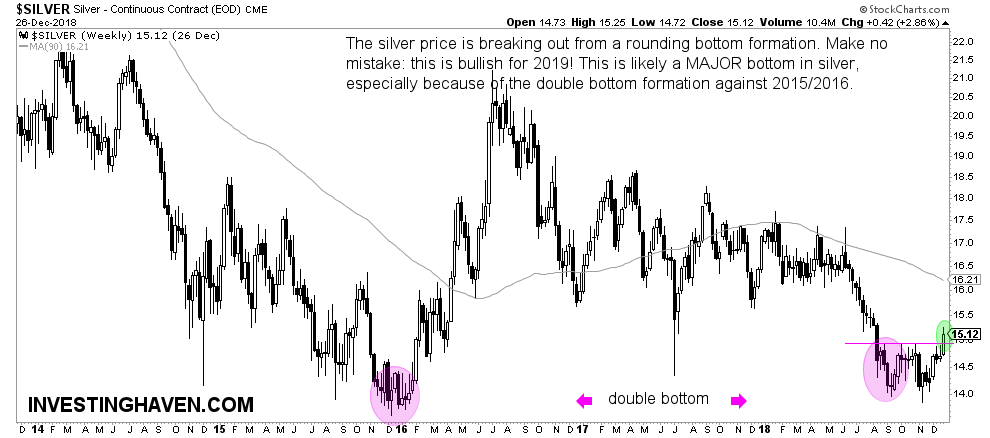
The breakout which is beautifully shown on the daily chart should be checked on the weekly chart as well to understand how this fits in the more dominant (longer term) trends.
The weekly chart shows not only the current breakout but also two more things.
First, it shows a giant double bottom, which, as well, is bullish in nature! It also confirms a bullish start of 2019.
Second, the weekly silver chart also shows a higher low, especially against the December 2015 low. A higher low is a bullish long term signal.
What we can derive from this weekly silver chart is a price target for 2019. We see a congestion in 2017 and 2018 in the 16.5 to 18.0 area. That’s our first price target.
Our most bullish case is the top of the previous decline. It would be in the 20 to 21 area. This is really feasible for silver to get there.
What all this implies is that silver stocks will likely go up very strongly in the first months of 2019. We expect First Majestic Silver (AG and FR.TO) to go up at a minimum 30% and best case two fold before summer 2019.


