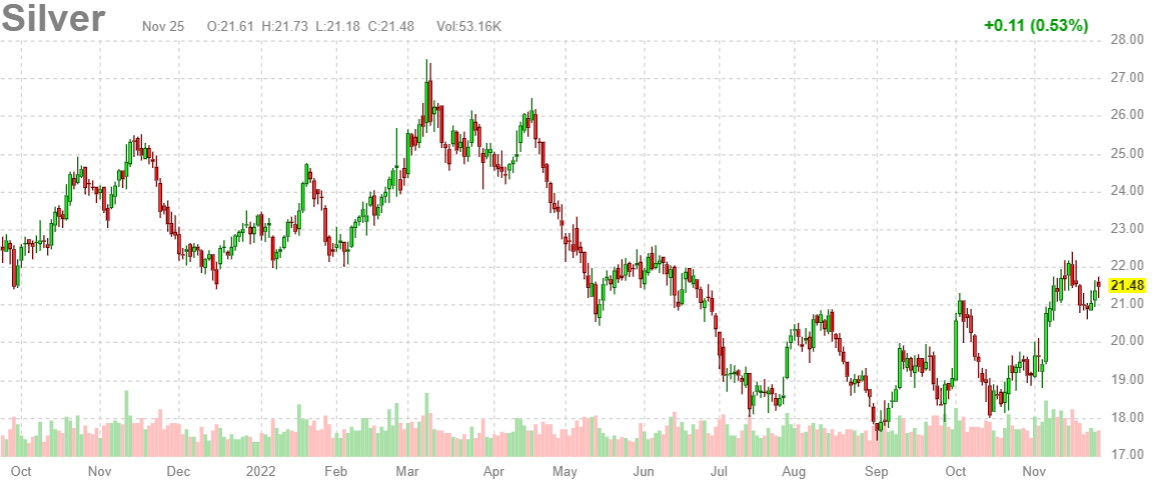
The silver price chart is about to complete a wildly bullish reversal structure. The timing of this is perfect: rates seems to be peaking, the USD seems to be topping. This implies (a) no market crash (b) amazing fundamentals for gold and silver. Although rates and the USD, leading indicators of silver, may try to move one last time slightly higher, we do expect the really explosive intermarket effect to start kicking in as we head into the first quarter of 2023. Our silver price forecast might be conservative, is what we are thinking when we check the daily silver price chart.
We can be short, very short, when it comes to the silver price chart.
The daily chart looks absolutely powerful, bullish.
The structure that is being created in the last 6 months is almost complete. It is a very strong bullish reversal. It started around June 20th, with a breakdown around 20.50 USD. The subsequent structure is very powerful.
The 18 – 22 area is a bullish pattern but becomes even more bullish when considering the context: a +2 year consolidation. Both combined are the ultimate chart confirmation that silver is close to starting a strongly bullish trend, the one we have been writing about since last year.