It has been a while since we covered the uranium stock sector (URA). A few months ago we provided extensive coverage of uranium stocks like Uranium Energy Corp’s (UEC) and Fission Uranium’s stock forecast. Moreover, we said to be bullish on the sector based on our uranium stock sector forecast for 2019 provided the uranium spot price would trade above $28.50. Today, we see a divergence between the chart setup of uranium stocks vs. the uranium spot price. What does this suggest? And is the uranium sector a potential candidate for our TOP 3 investing opportunities of 2019?
As a reminder, our uranium stock sector forecast made the point that by far the most important indicator is the spot price of uranium. This is what we wrote:
- What if the $28.50 level in uranium spot price holds, and the gap to $35 to $38 will be closed? This would be wildly bullish for uranium stocks.
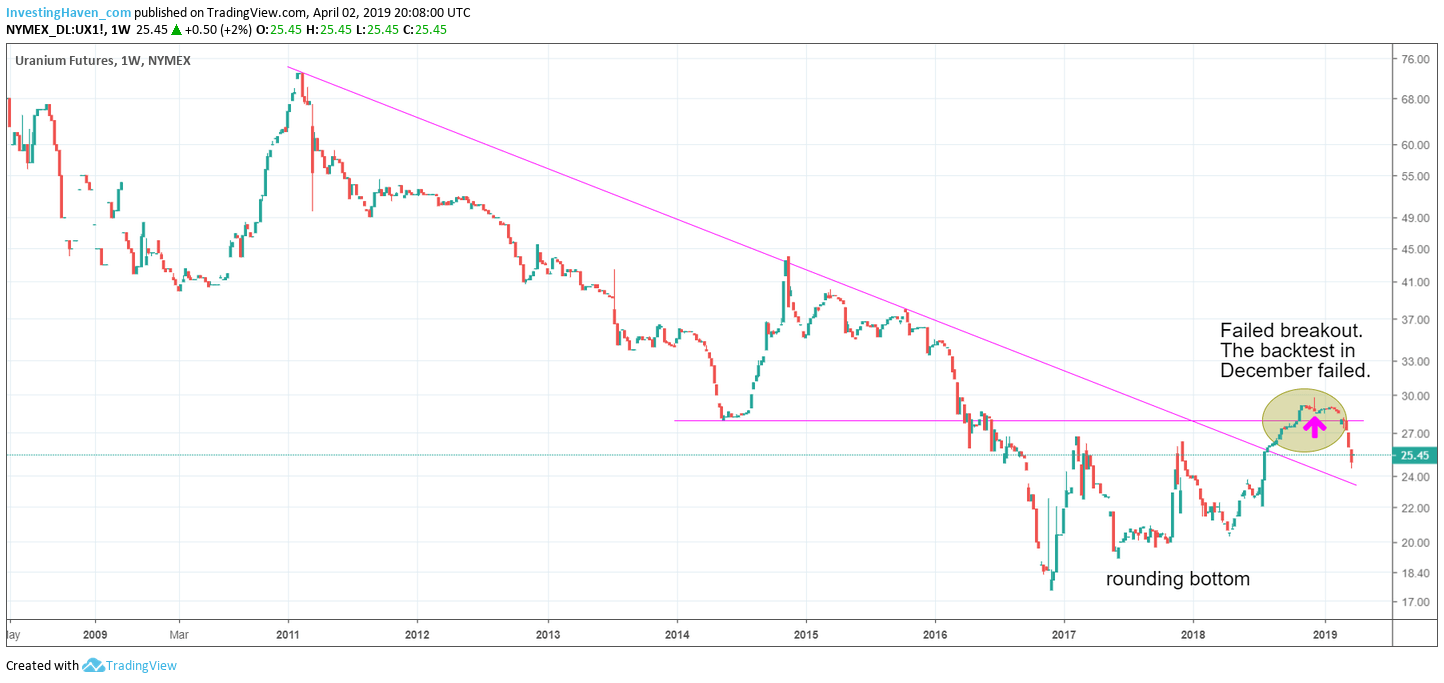
- What if the $28.50 level in uranium breaks down? This would be bearish, and uranium spot would be eyeing $24.50 a few months later.
That said, where do we stand with the spot price of uranium?
The chart below is the uranium futures chart. It really does not look good.
The failed breakout in January made place for a serious retracement. This might still have a bullish outcome, only if the uranium price rises back above $28.50.

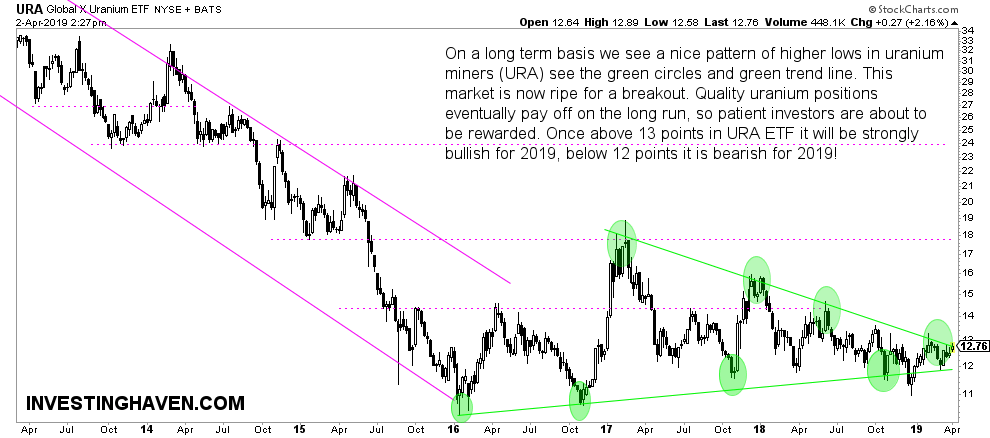
On the other hand uranium stocks based on the sector ETF URA show a bullish chart setup.
This triangle setup favors a bullish outcomes provided the uranium price stops falling right here right now.
The divergence between the two charts in this article do not suggest the uranium stock sector is a great play with the current setup unless an URA ETF bullish breakout comes with a sharp uranium spot price rise.
As long as there is no convergence between both charts there is no way this sector qualifies for a top 3 investing opportunity in 2019.


