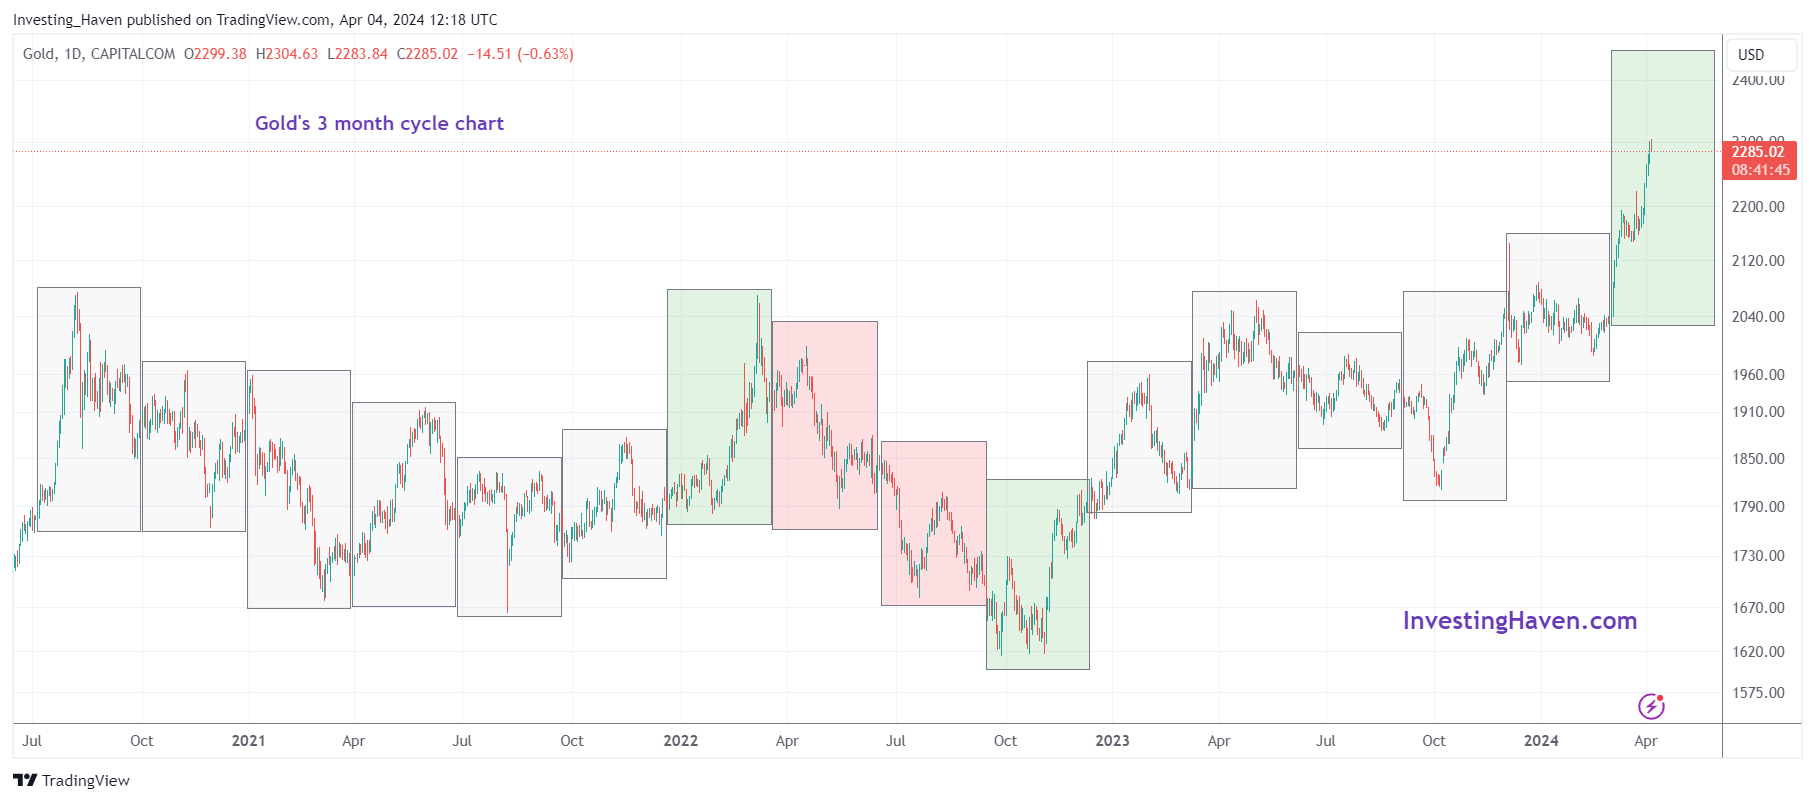
Gold is crushing it. Our 2024 gold price target was hit this week. Investors are asking whether this implies that the gold rally is over or whether gold will continue to rise. Our viewpoint is that gold can and will continue to rise until May 2024.
Gold price rally
It is blatantly clear – the gold price rally has legs.
That’s because of three reasons:
- The gold price rally started exactly on the first day of gold’s 3-month cycle, on March 1st, 2024.
- It’s not just gold – it is also silver that is rising.
- It’s not just precious metals – it also base metals that are rising. It’s a sector move.
Whenever a rally, for instance in the price of gold, is accompanied by rallies in similar segments, we have enough confidence that sector rotation will keep the rally alive.
Gold price chart
The gold price chart is certainly a beauty, without any doubt.
The 100-year gold chart may be insanely bullish. However, it does not help us understand the immediate future. Moreover, as said many times, contrary to 99% of analysts, we look at two chart angles:
- Price
- Time
That said, the gold chart below with our timeline annotation features 3-month cycles. This helps us understand bullish and bearish cycles (also neutral cycles, in grey) which typically occur in a 3-month period.
As seen, the current 3-month cycle, which started on March 1st, 2024, and ends on May 31st, 2024, is a strongly bullish cycle for gold.

Note – as said many times in the past, we prefer not to follow mainstream news outlets because they are always lagging. Whether Powell’s comments are driving the price of gold, as suggested here and here, is completely irrelevant.
Gold price target
Investors are asking how high gold can rise. That’s why we try to derive gold price targets by looking at gold’s chart from a price and time perspective.
The gold price chart shown above suggests that gold will continue to rise within this current 3-month cycle. If this is true, we expect a local top to be set somewhere in May, presumably around mid-May.
There is a reasonably probability that gold will move to $2,500 in May, it might exceed it but not necessarily on 5 to 8 day closing basis, according to our expectations.
We need to look at gold’s rally by grouping 5 and 8 daily candles in order to identify a local top, towards the end of its 3-month cycle.
Remember, while gold’s rally is impressive, the one in silver should be much more impressive.
For more detailed alerts, we recommend you sign up to our weekly gold & silver market reports >>


