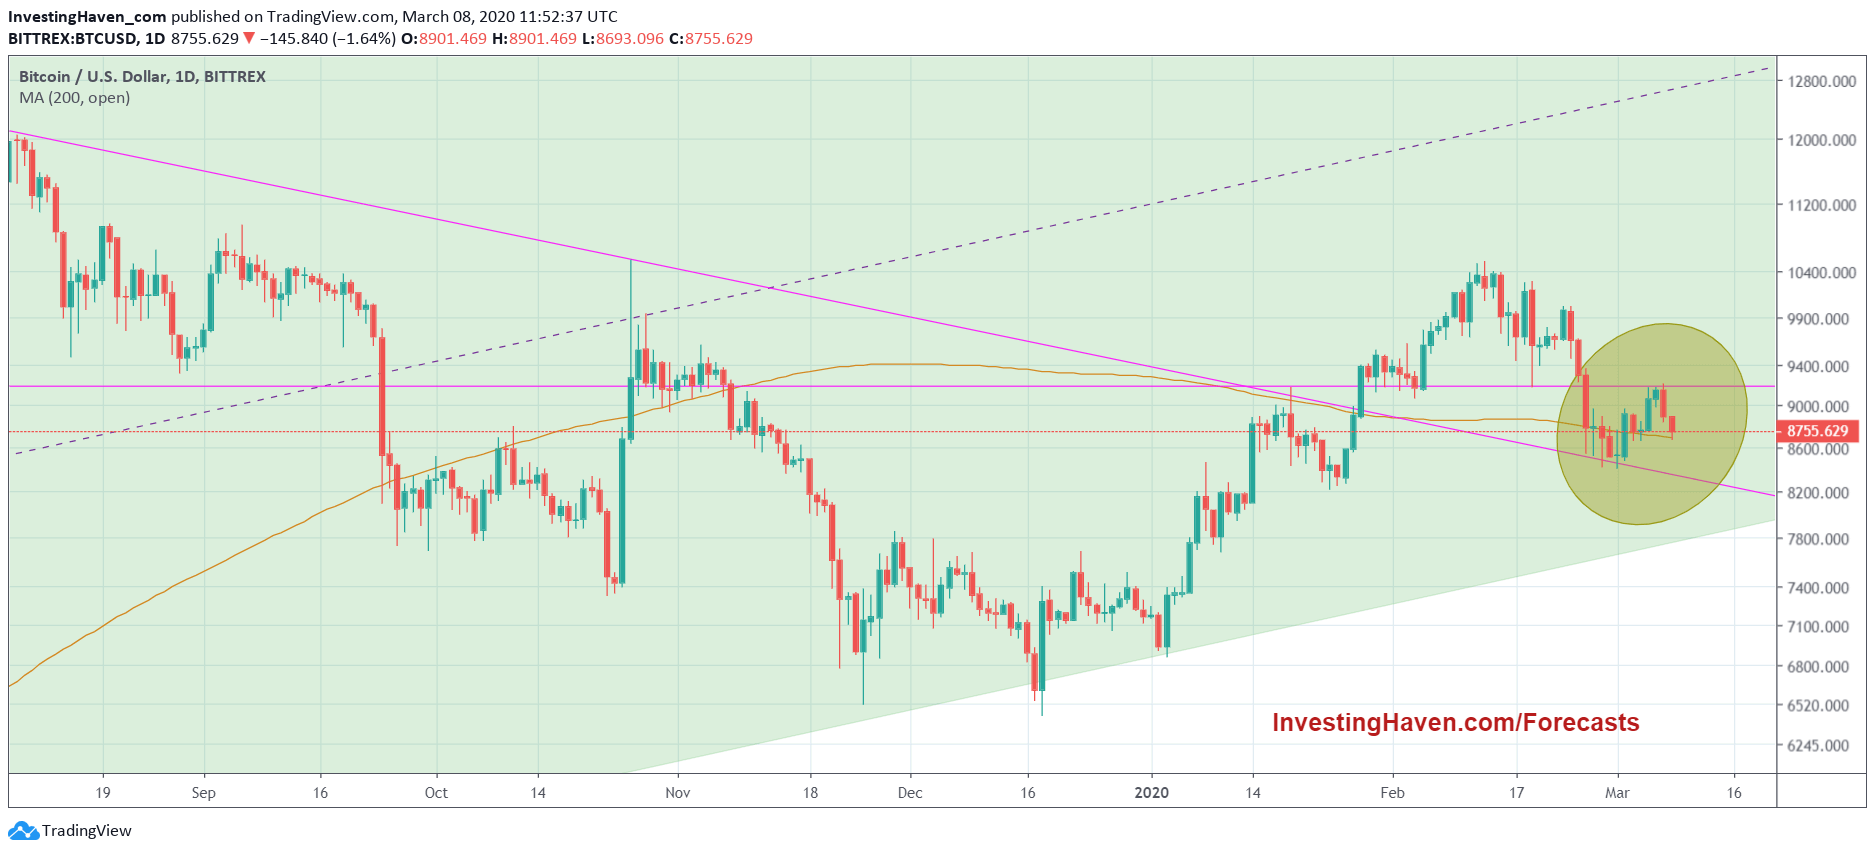
Bitcoin lost 4 pct today. In relative terms Bitcoin has seen a mild retracement from its February highs. It may have been a 20% decline but being the most volatile asset in history of mankind this is a relatively small drop. Note that Bitcoin tends to rise of drop 20% when it becomes ‘really’ volatile. So far no harm done to our Bitcoin forecast nor did we identify any reason to believe our crypto predictions are at risk.
Bitcoin’s chart shows what’s going on right now.
We are fans of chart patterns, and we go pretty far in charting things out, as our crypto premium members know by now.
At this point in time we see that Bitcoin’s price got stopped exactly at 9250 USD. That’s an important level as it is support/resistance that goes back 8 months in time. Everything in the crypto space moves 10x faster, so 8 months may not seem a lot but it really is a long time in relative ‘crypto terms’.
The chart shows how Bitcoin is now trading:
- above its falling trendline,
- below horizontal resistance of 9250 USD,
- right at its 200 day moving average.
This typically requires a bit of time to resolve. We call it a ‘congestion area’ on the chart.
Bitcoin was rising fast until global market selling somehow spilled over to the crypto market. We saw a deceleration of Bitcoin’s rise, i.e. a slower pace of its rise.
For now bulls have the benefit of the doubt. The green area on below chart represents the ongoing bull market. We may see a test of support, but the chart patterns suggest that Bitcoin will move higher in 2020.
More detailed analysis on Bitcoin is for our premium crypto members. They also get detailed chart analysis and commentary of our top 5 cryptocurrencies. This is the level of insights every crypto investor requires. It’s the level of quality and detail that you simply will not find on social media nor financial media.


