This is great: a silent bull market in Bitcoin (BTC), and, consequently, in the crypto market. Admittedly, it may not feel that way, but that’s why it is so great! Moreover, as we saw on twitter this week, the last bull standing is giving up. In the meantime Bitcoin shows bullish signs: a series of higher lows. This combination is exactly what we forecasted on January 27th 2018 to our premium crypto subscribers. Read on to discover a Bitcoin price bullish in 2018.
How can the Bitcoin price be bullish if the last crypto bull gave up is what you must be thinking! A Bitcoin price bullish is determined by the chart, sentiment and overall market conditions, read on to understand our viewpoint.
Bitcoin price bullish if the last bull gave up?
First, the notion of the ‘last bull standing’, or, in this case, the last crypto bull standing. It is our dear friend founder of Ethereum: Vitalik Buterin. Yes he is a genius, without any doubt. In all honesty, we were doing totally different things when we had his age, hat off.
However, what strikes us is the media attention he got on his quote on Bloomberg last week, see the article. Moreover, on twitter, what stood out is the engagement from readers on this post and, particularly, his quote “no more crypto boom”. Unbelievable, really.
Let’s face it: exactly 9 months ago it was really the opposite. What changed in 9 months? The technology? The use cases? The disruptive potential? Nothing of all that is the only answer!
What changed is sentiment, especially among investors but also from anyone else on this world. Even people not invested in Bitcoin or crypto have used the price, both in the ‘bubble’ but also during the ‘crash’, as a gauge to assess the whole sector.
Did anyone notice this? What’s the word that comes to mind? Yes, emotional, and emotions as said many times before are the recipe for disaster of anyone’s portfolio.
Bitcoin price bullish based on the start of a series of higher lows in 2018
Setting any emotion aside the only two things that matter are (1) the disruptive potential of the crypto technology (2) the Bitcoin price chart. All the rest is noise!
As said many times before the Bitcoin chart is the leading indicator for the crypto market.
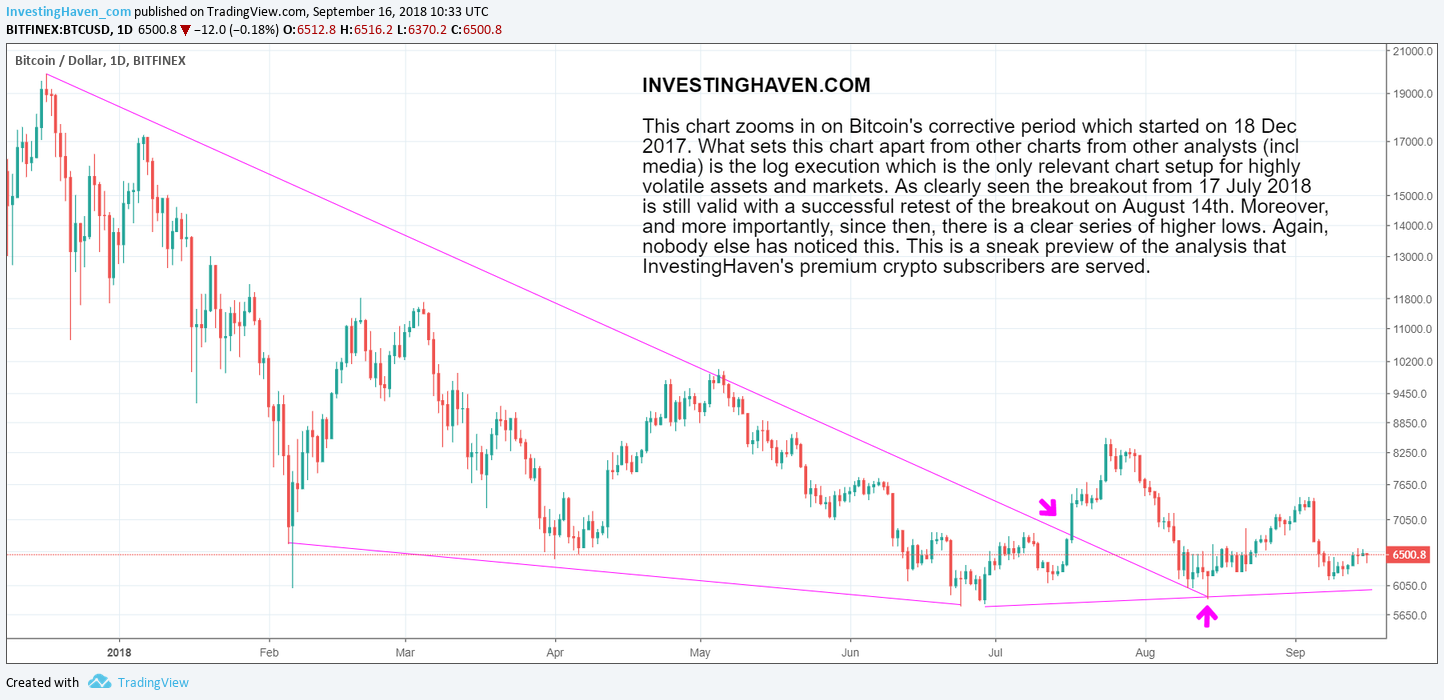
And it shows that the Bitcoin price is bullish because it recently started setting a series of higher lows in 2018!
Below chart zooms in on Bitcoin’s corrective period which started on 18 Dec 2017. What sets this chart apart from other charts from other analysts (incl media) is the log execution which is the only relevant chart setup for highly volatile assets and markets.
As clearly seen the breakout from 17 July 2018 is still valid with a successful retest of the breakout on August 14th. See the 2 purple arrows.
Moreover, and more importantly, since then, there is a clear series of higher lows. Again, nobody else has noticed this.
All this is great, because it suggests a silent breakout and a silent bull market. It is the perfect dream for any crypto bull. It is a pattern that has occurred over and over again in history, in countless markets and stocks, and continues to be relevant, also in the crypto market!
Note, however, Bitcoin must continue to trade in this pattern that it started in the summer of 2018. Our bullish case might be invalidated once this pattern is broken to the downside. Another pattern will appear to be dominant, and we have shared last week with our premium crypto subscribers which alternative we look at in the background.
This article, chart and analysis is a sneak preview of the analysis that InvestingHaven’s premium crypto subscribers are served, you too can become a member NOW >>


