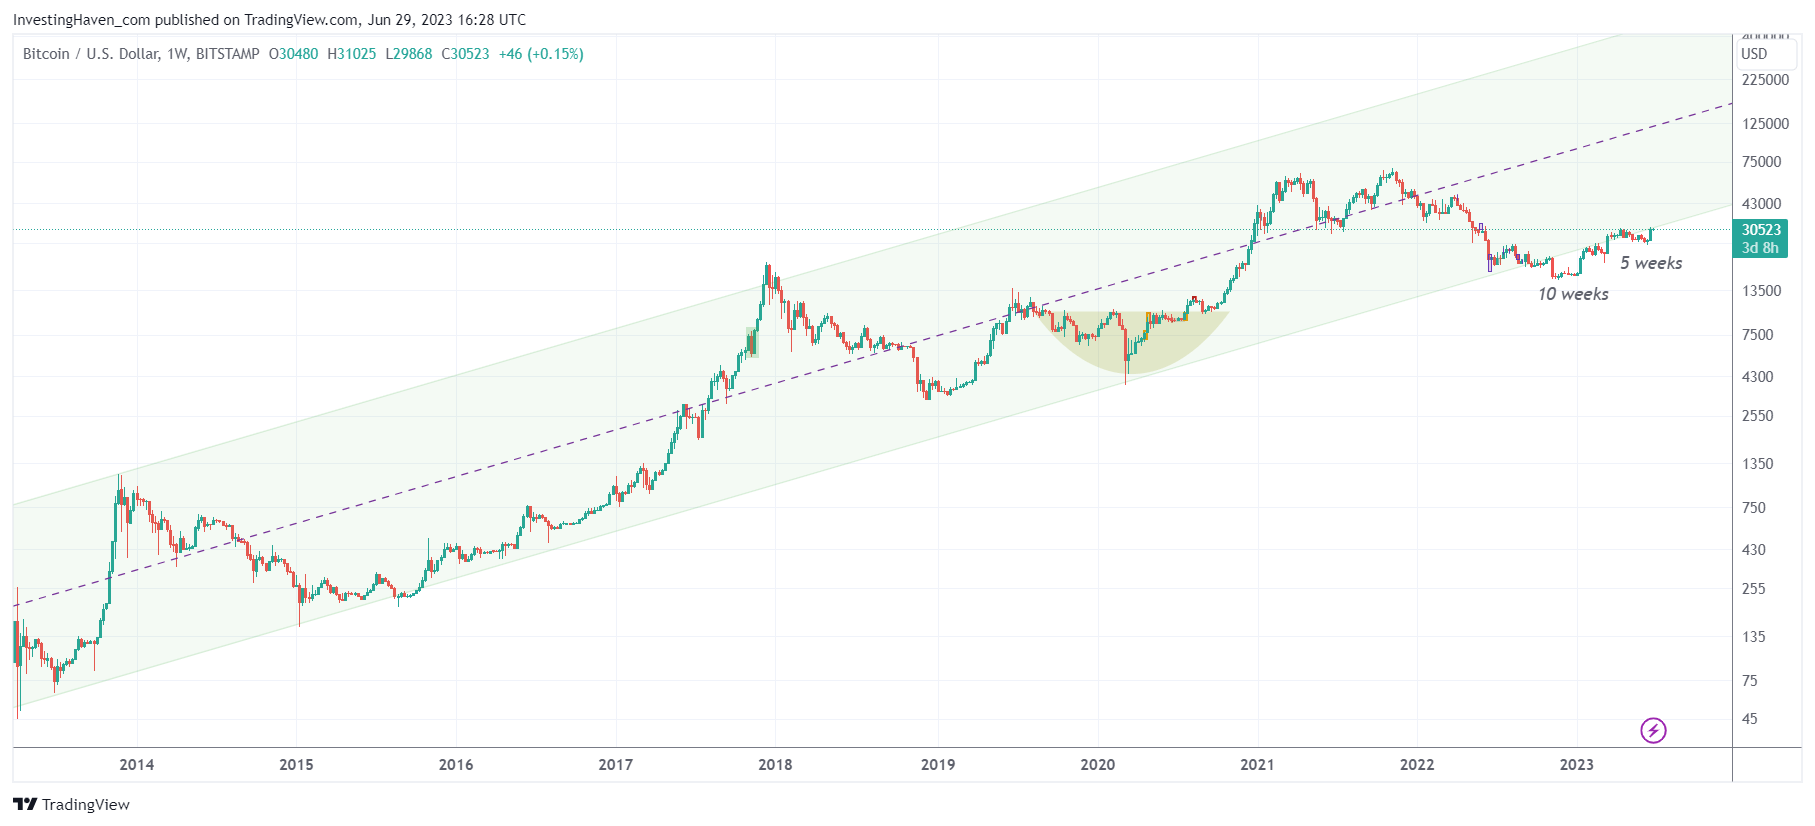
Bitcoin, the leading cryptocurrency, has been captivating the financial world for over a decade. In recent times, Bitcoin has been testing a remarkable 10-year rising channel, adding to the intrigue surrounding its future trajectory. In this post, we will examine the long term Bitcoin chart enriched with our own annotations. We explore the implications of Bitcoin’s current position within this long-term channel.
More than a month ago, we wrote Bitcoin’s Downside Targets And Bullish Outcome Conditions For June 2023 with this conclusion: “Bitcoin is for sure going to test the 25.5k level, in the month of June.”
More recently, last week to be precise, we focused on the short to medium term Bitcoin chart in this post The Single Most Important Crypto Chart To Track In July of 2023. We concluded: “July & August should be good months for BTC, a breakout is highly likely” which was a conclusion based on the scenario in which Bitcoin would clear its rounded pattern.
In this article we focus on the secular chart.
The Bitcoin Chart
To gain a visual understanding of Bitcoin’s price action, let’s refer to the chart embedded below. The chart displays a 10-year rising channel, capturing Bitcoin’s upward trend since its inception. This channel acts as a technical indicator, highlighting significant levels of support and resistance over the years.
Bitcoin’s 10-year rising channel is a testament to its resilience and long-term growth potential. As the chart reveals, Bitcoin’s price has adhered to this channel, bouncing off the support line multiple times during market downturns and finding resistance near the upper boundary during bull runs. The channel’s durability suggests that it has served as a reliable guide for investors navigating the cryptocurrency’s volatile price fluctuations.
Examining the chart closely, we can observe that Bitcoin is currently testing the upper boundary of the 10-year rising channel. This indicates that the cryptocurrency is at a critical juncture, as it approaches a level that historically has presented resistance. The outcome of this test will be crucial in determining Bitcoin’s future trajectory.
Forget the news & events, only price matters
It is important to note that events and news surrounding cryptocurrencies, such as regulatory actions or developments in specific companies, do not necessarily dictate Bitcoin’s price movements in the long term. While short-term volatility may occur in response to such events, the overall trajectory of Bitcoin’s price is driven by broader market forces, investor sentiment, and the underlying fundamentals of the cryptocurrency ecosystem. Bitcoin’s decentralized nature and its global reach make it less susceptible to individual events or news events that might impact traditional financial assets. Therefore, it is crucial for investors to focus on understanding the macroeconomic factors, technical indicators, and market sentiment that influence Bitcoin’s price action, rather than placing undue emphasis on specific events or news events.
In the context of recent events involving crypto companies like Celsius or regulatory actions such as SEC lawsuits, it is worth noting that while they may generate short-term fluctuations in Bitcoin’s price, they are not the sole determinants of its long-term value. Bitcoin’s price is influenced by a complex interplay of factors, including supply and demand dynamics, institutional adoption, macroeconomic trends, and investor sentiment. Therefore, investors should take a comprehensive approach to analyzing Bitcoin’s price movements and consider a wide range of factors beyond specific events or news events that may capture media attention.
Implications for Bitcoin’s Price Action
One important rule of thumb as it relates to price action: any move that confirms or rejects a chart pattern requires 3 to 5 days to complete. Moreover, on a secular timeframe on the weekly chart, it may require 3 to 5 weeks. In other words, day to day price changes are irrelevant as it relates to the 10-year Bitcoin chart. It really is a multi-week move inside the secular channel that we require to confirm the validity of the uptrend.
If Bitcoin successfully breaks above the upper boundary of the 10-year rising channel, it could signal a significant bullish breakout. Such a breakthrough would suggest that Bitcoin’s upward momentum is accelerating, potentially leading to further price appreciation. This scenario would likely attract renewed interest from investors and could fuel additional buying pressure.
However, it is important to note that if Bitcoin fails to break above the upper boundary and experiences a rejection, it could result in a period of consolidation or even a short-term correction. Such a development would not necessarily invalidate Bitcoin’s long-term bullish outlook but could signify a temporary pause or a period of price consolidation.
Conclusion
Bitcoin’s current position within its 10-year rising channel is of significant interest to market participants. The cryptocurrency’s ability to test the upper boundary presents an intriguing scenario, with potential implications for its price action. A successful break above the upper boundary could pave the way for further bullish momentum, while a rejection could lead to consolidation or a short-term correction. As with any investment, it is crucial to conduct thorough research, consider risk management strategies, and consult with financial professionals before making any investment decisions related to Bitcoin or any other cryptocurrency.
In the coming 3 to 4 days, we will publish an update of our top token watchlist in our premium crypto service. We are planning to pick out the tokens that are most likely to outperform the crypto market in July & August. On January 7th, 2023, we picked out the ‘AI & Big Data’ tokens as our top picks, a few days later they started an epic rally and several of them went up multi-fold. We are doing everything to replicate this success!


