Recently, we mentioned that Bitcoin’s Secular Chart Remains Phenomenal. That’s the long term view, multiple years out. When we look at the shorter term, say several weeks out, we see a slightly different picture. Not a bearish picture, but not a bullish one. However, if we add chart patterns and look very carefully, there is a very interesting setup in the making. The month of June will deliver a lot of valuable information for crypto investors, particularly the BTC chart. We are on record forecasting a hot summer for crypto investors provided …
Let’s focus on the chart setup and the valuable (also actionable) information that the BTC chart has to offer.
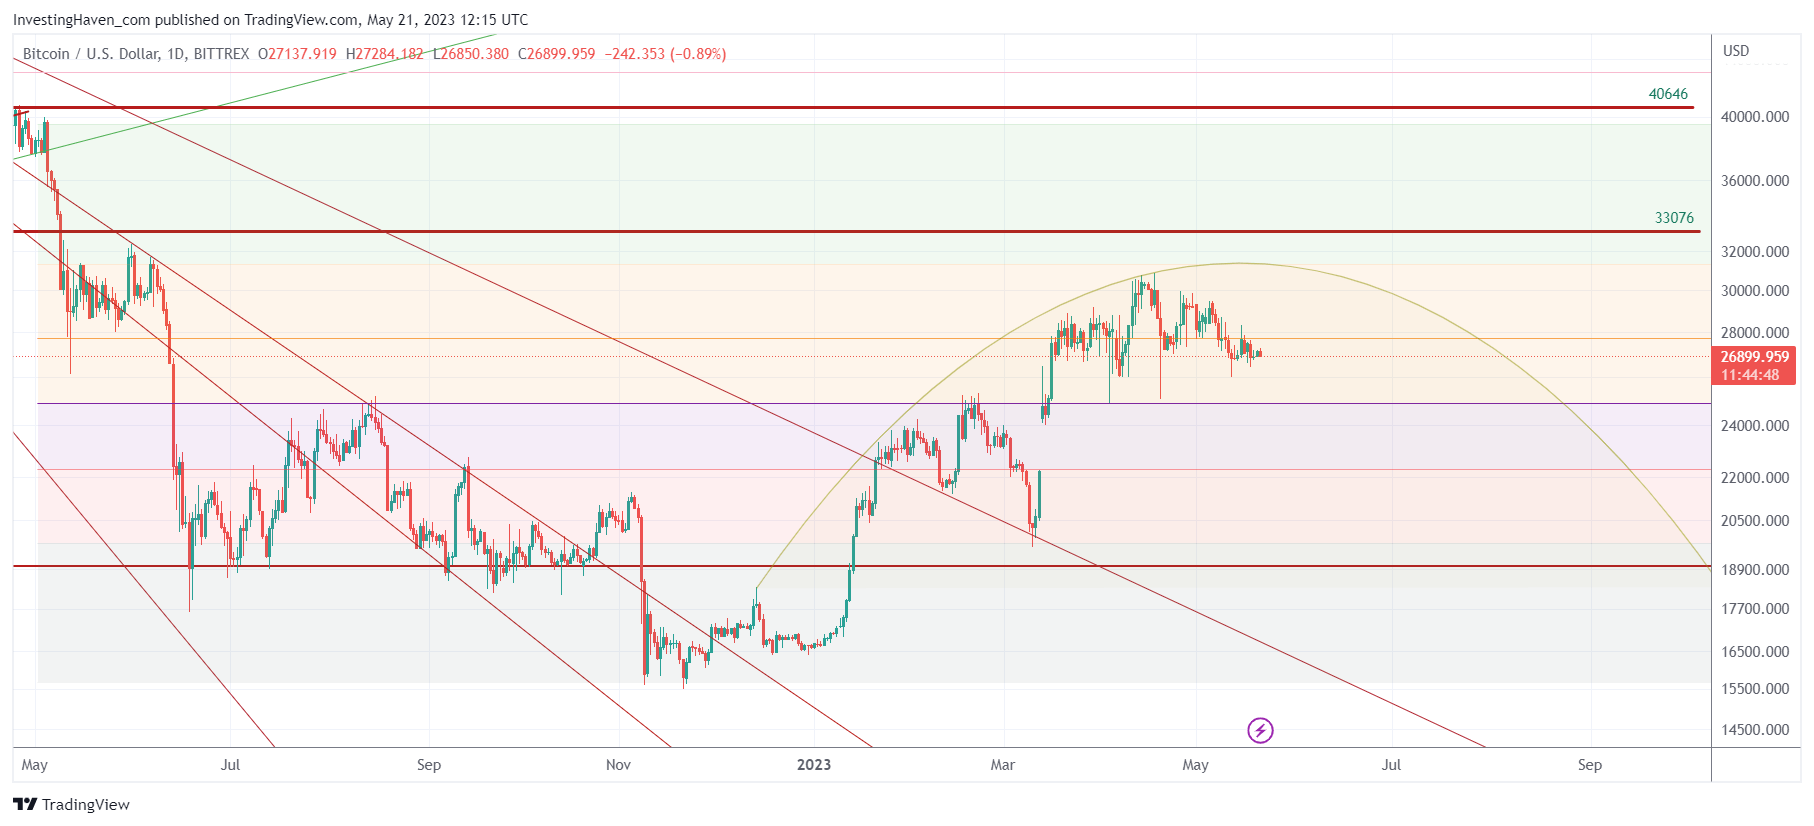
At first sight, it looks like a topping pattern, one that started in January of 2023 and has a midpoint approximately now, see the rounded chart pattern with a fine border.
When charting patterns to identify trends, what matters most is the combination of patterns and levels.
When we apply this to the BTC chart, we get much more color which we added to the chart… with multiple colors:
- The green shaded area is the highest area of the reversal. This is where typically an acceleration take place.
- The yellow shaded area is the one where the market has to confirm a bullish breakout. That’s where BTC is trading right now. Very often, when price reaches the yellow shaded area, it is fair to expect a back-test of the lower levels. That’s where it gets interesting, because what will matter is the level that is going to provide most support, ideally it is the purple area.
- The purple shaded area represents the 61.8% to 50% retracement area. We prefer to think in terms of areas, not price points, for obvious reason.
- Everything that is happening in the red and grey area is literally red and grey.
Bitcoin is for sure going to test the 25.5k level, in the month of June. What matters most is whether 25.5k USD will hold on a 3 to 5 day closing basis. Moreover, IF Bitcoin would drop below 25.5k, it really must find support around 22.2k. IF (that’s a big IF), this is going to occur, it would be a bullish back-test which is going to increase the probability of a bullish outcome.
In our premium crypto research service, we shared a multi-year chart with 7 year pattern, on one of the 7 Bitcoin charts (chart structure) that we are tracking for our members. We recommend checking out our alert, published on May 20th, available in the restricted area, if you want to ride the crypto summer which might be very hot. But, first, we need the market to confirm our bullish scenario. We will know, for sure, in max 6 weeks from now whether the summer will be hot for crypto investors.


