The 6 week consolidation in Bitcoin is one of the strangest we have ever seen. It is for sure the most unusual short to medium term consolidation pattern in BTC in recent history, if not in its entire history. We’ll have to distinguish between short and long term, and visibly both timeframes look differently. Note that this is a net new insight compared to what we wrote in our Bitcoin forecast.
Sunday morning US time, BTC goes lower with an ugly red candle.
Is this a recurring pattern? Anyone?
It is, and it’s clear that short to medium term BTC is struggling with support. We shared some very insightful and actionable charts with our premium crypto members this week, they are available for anyone who signs up to our deep investing and chart research here.
Short to medium term we see a very odd chain of bullish and bearish patterns in the context of a 6 week consolidation. We shared 2 insights with our premium members based on our research:
- BTC 9450 USD is the line in the sand for short and medium term crypto price trends.
- Friday June 12th, 2020 is a major milestone for a new bullish or bearish trend.
So far short to medium term.
But what about the long term?
We did share in this weekend update in our premium crypto investing research 2 charts that we ‘give away’ in the public domain, along with our commentary. Note that these 2 were part of the weekend update which contained 5 other (cooler) charts.
The long term trend in crypto is UP. And we wanted to make a point about a bullish scenario that might play out in 2020, and what it would mean for the long term trend.
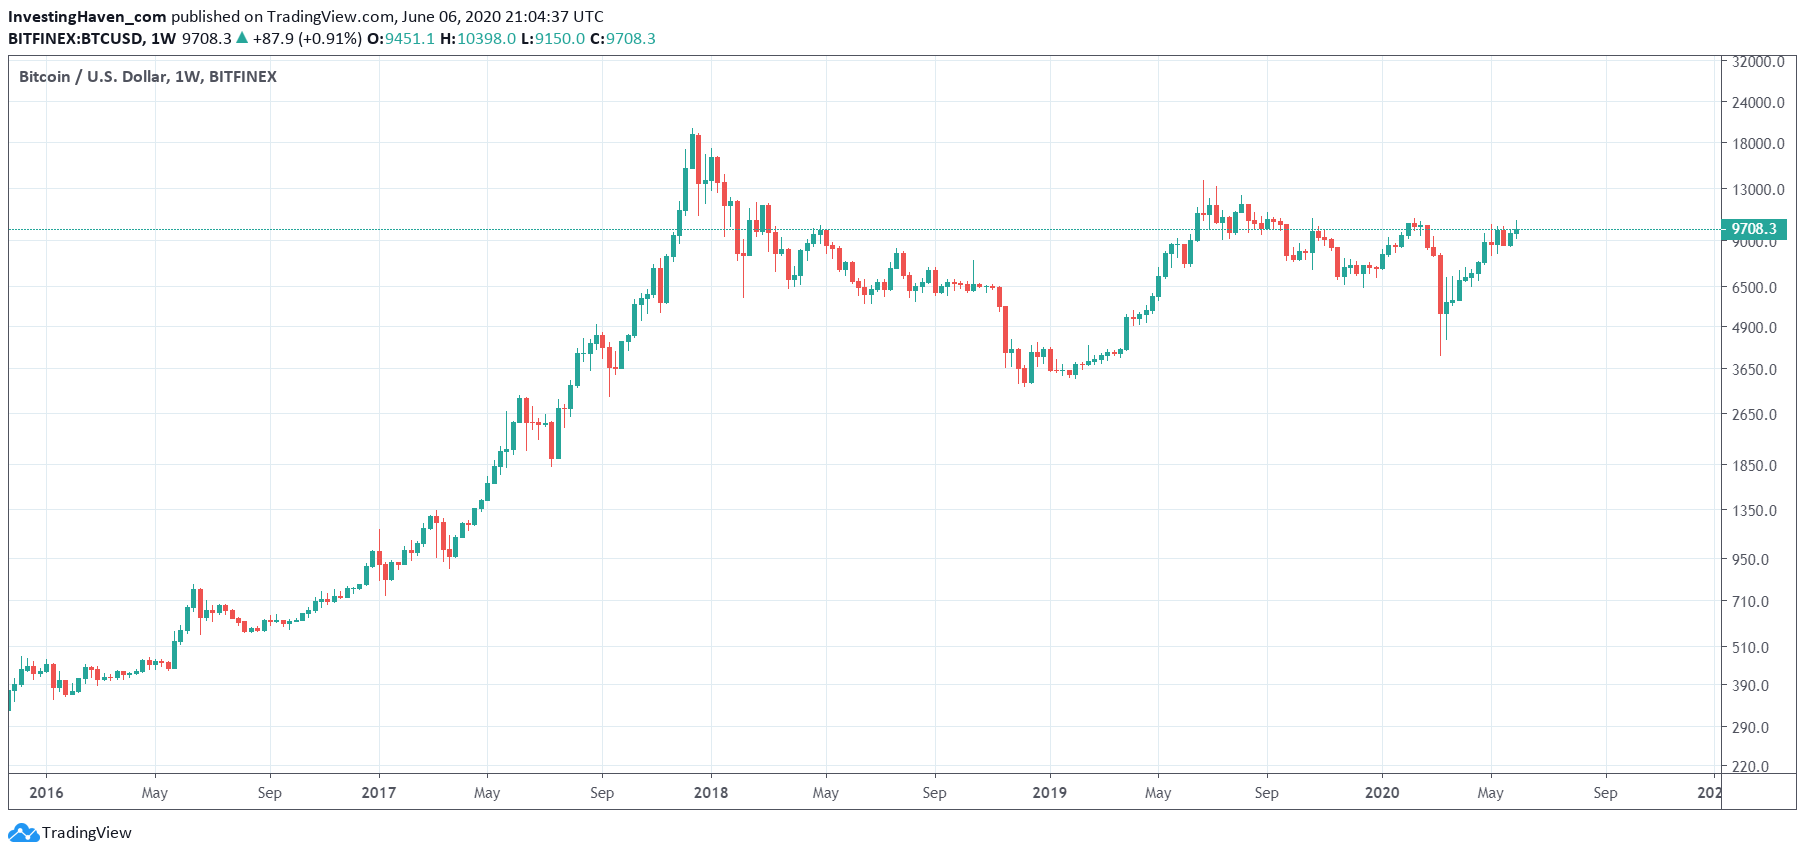
The weekly BTC chart without annotations is shown below, on 4.5 years.
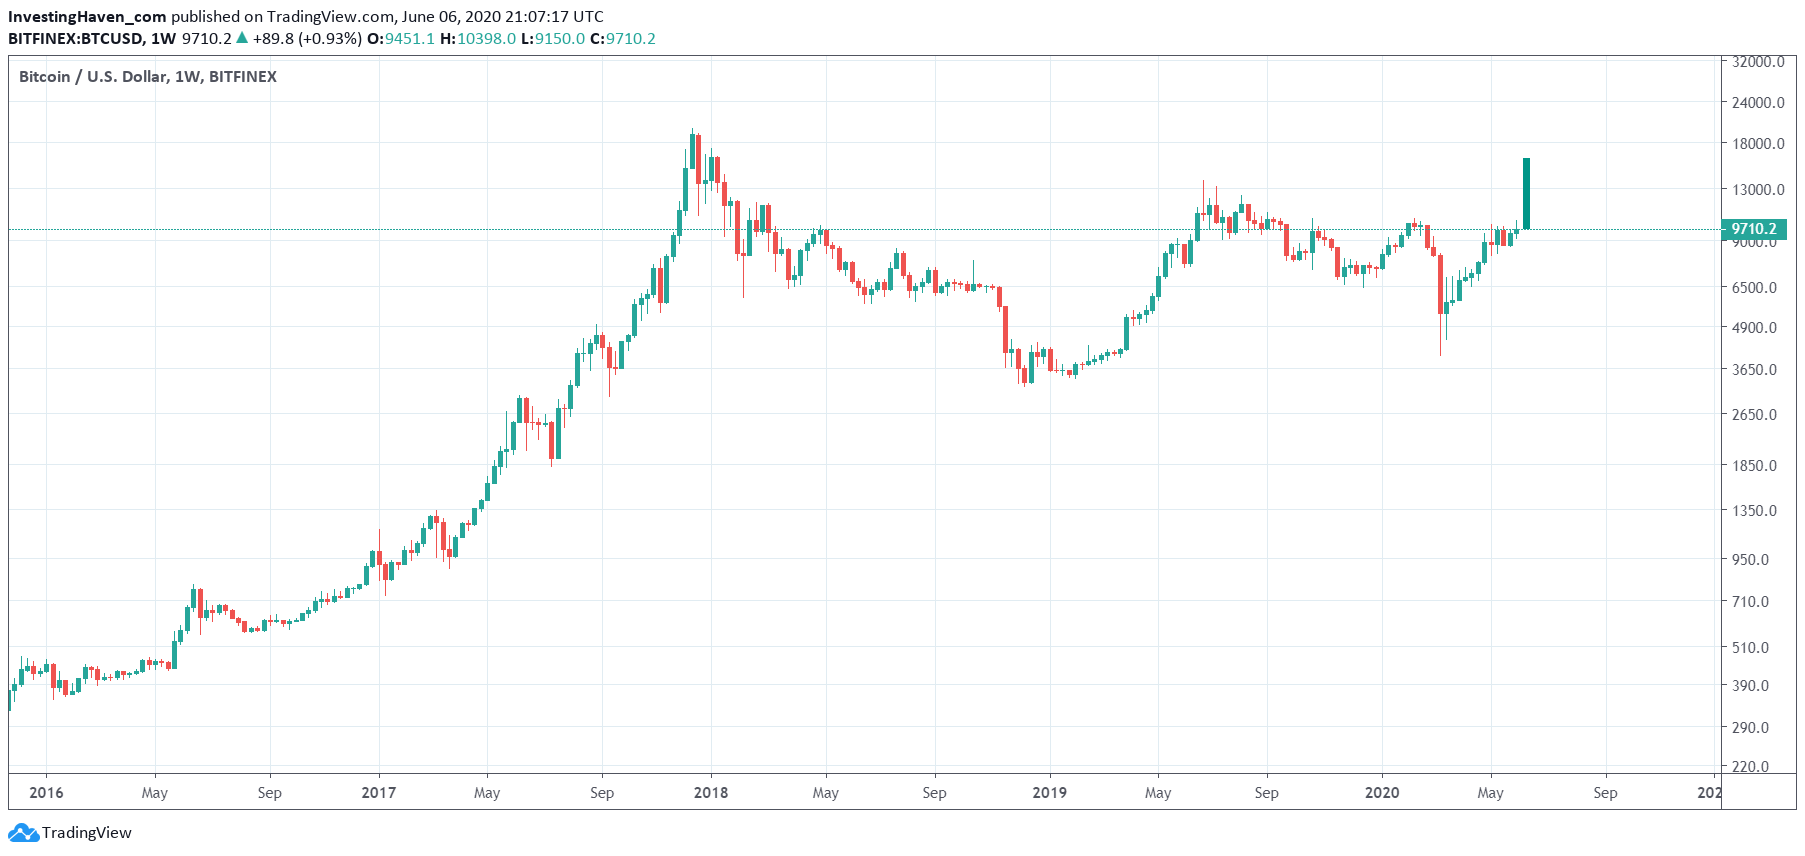
This chart really has a strong bullish bias, clearly. But it urgently needs a structure that goes from 10k to 16k USD.
Not able to envision what we are saying?
We created a chart which helps you visualize what we are saying.
If we say the above chart has the potential to morph into a very bullish setup, we mean the following, see next chart. Note that this large green candle was added by ourselves, it’s not a real chart at the time of writing. All we are doing is showing you how big of a difference a rally to 16k ideally in the next few weeks would make. How different would be the real chart become, is what we try to show. Really bullish IF this happens.
Again, below chart has this large green candle annotated by ourselves. We try to make a point on the bullish potential of the current setup!

Please take a minute to compare the two charts shown above.
And that’s how long term and short/medium term come together:
- All we need in the short to medium term is BTC to move above 10.5k. Once this happens we will have the ultimate confirmation that the altcoin reversals will morph into new bull markets.
- If BTC does not set this large green candle which we annotated on the 2nd chart in this article it might take several more months until this long term uptrend accelerates.
Time will tell, but we do know that the coming days will be crucial.
Follow our cryptocurrency investing research for crucial crypto market updates, deep insights from the charts, and tips on top altcoins.


