BTC Price Predictions
Featured prediction **June 26th**
- [ALERT] – We wrote “BTC will set a higher low in the first week of May, after which volatility should start fading and a bullish trend may start.” It happened as predicted. While BTC may remain choppy around $100k, it is set to resolve higher in 2025. Read more on this page.
BTC predictions from 7 top forecasters:
- A selection of 7 experts are unanimously bullish on Bitcoin: consensus BTC price predictions around $200,000 by 2025. While aggressive, these BTC forecasts for 2025 seem realistic given the bullish nature of the long term chart pattern.
BTC timeline forecast:
- Bitcoin’s predicted consolidation time window was March 14th – April 13th (accurate), our predicted bullish trend would start on May 10th (accurate). However, the rally was short-lived and not intense. The next bullish window should start somewhere mid-July to mid-August (TBC).
Table of contents
- BTC Price Prediction 2025
- BTC Price Prediction 2026
- BTC Price Prediction 2027
- BTC Price Prediction 2030
- BTC Price Predictions by Top Forecasters
- BTC Price Predictions from Institutions
- BTC Price Predictions from Banks
- BTC Price Predictions Online
- BTC Price Predictions: Industry Study
- Bitcoin to $1 Million Prediction
- Bitcoin Price Drop Predictions
- Bitcoin Price Prediction Tomorrow
- Bitcoin Predictions day-by-day
- Bitcoin Historical Prices
- FAQs
Bitcoin price predictions overview
| Year | BTC price prediction |
|---|---|
| 2025 | $80,840 - $151,150 |
| 2026 | $99,999 - $189,000 |
| 2027 | $210,000 |
| 2028 | $251,000 |
| 2029 | $275,000 |
| 2030 | $300,000 |
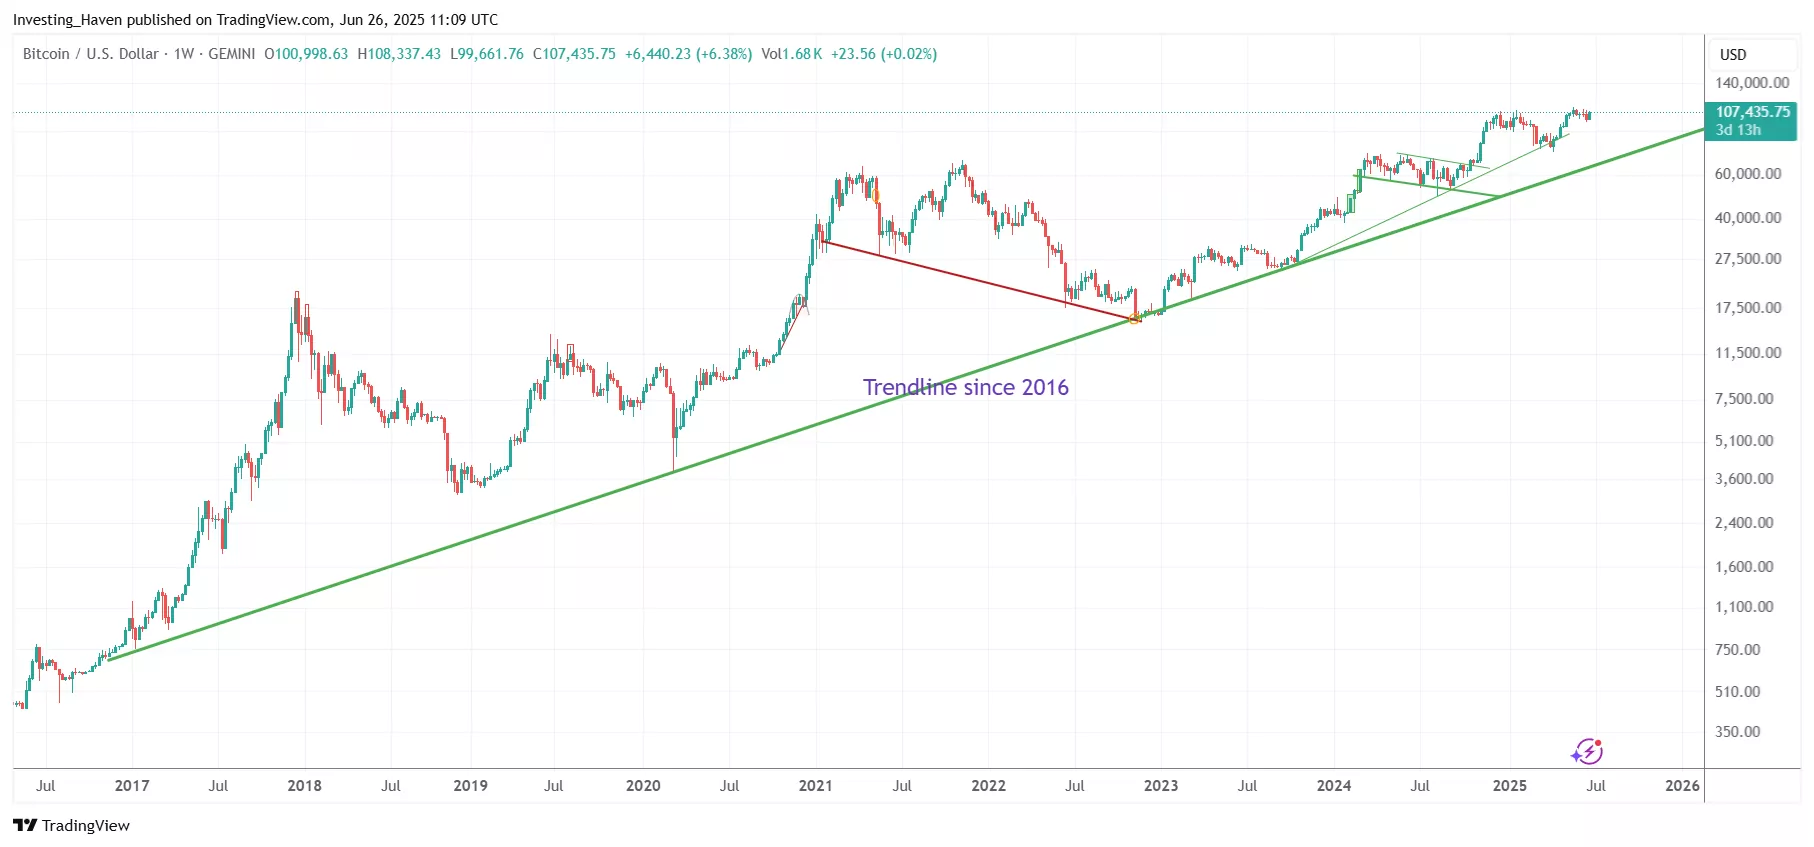
Bitcoin’s chart pattern prediction: a giant bullish cup and handle chart pattern which has to resolve higher for BTC predictions to be validated. Invalidation: BTC falls + and stays < $29,217.
Bitcoin Price Prediction for 2025
Bitcoin price prediction 2025 – Bitcoin’s long-term bullish chart pattern points to a new ATH in 2025. Bitcoin’s forecast for 2025 ranges from a minimum of $80,840 to a maximum of $151,150 with the institutional wave acting as the ultimate catalyst.
June 26th – This BTC chart has a very bullish long term setup. Even if BTC would retrace, it remains very bullish. Ultimately, if and when BTC resolves higher, it should trigger a new alt season.
Bitcoin price predictions for 2025:
| Year | Price move | BTC price forecast |
|---|---|---|
| 2025 | Lows to highs | $80,840 - $151,150 |
| 2025 | Stretched target | $174,000 - $181,000 |
| 2025 | Buy the dip | $78,000 - $82,000 |
| 2025 | Invalidation | < $29,830 |
GO PREMIUM – Receive crypto market analysis and token tips >>
BTC predictions from top forecasters
A selection of the most reliable and reputable Bitcoin forecasters
Bitcoin predictions for by a selection of premium Bitcoin forecasters are all bullish. The Bitcoin price prediction of this group of experts is unanimously bullish with Bitcoin targets up to $200,000 for 2025.
Our assessment – This is a group composed by highly reliable experts, selected based on our expertise. Their viewpoint is solid, often also unbiased because they communicate as individuals (not as an organization or institution).
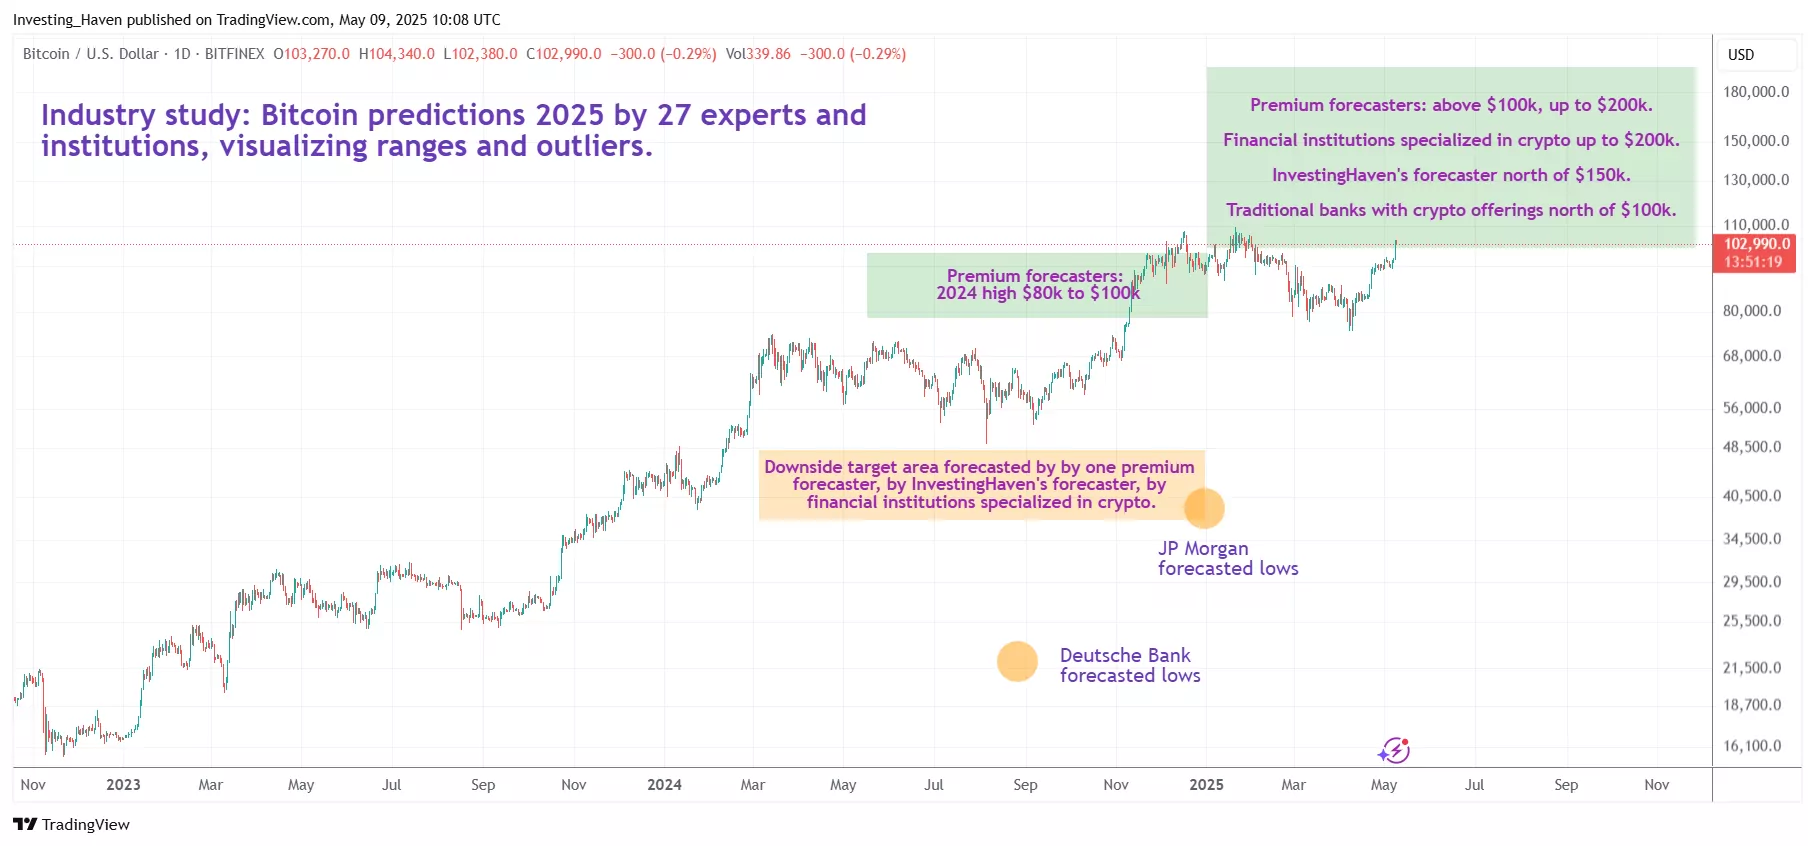
27 Bitcoin predictions summarized on one chart
| Forecasters | Bitcoin price predictions |
|---|---|
| Mike Novogratz | Bitcoin prediction new all-time highs in 2024. |
| Peter Brandt | BTC forecast for 2025 of $200,000. |
| Gerber Kawasaki | Bitcoin prediction directionally bullish, no specific price target given. |
| Samson Mow | Bitcoin prediction directionally bullish, no specific price target given. |
| Tone Vays | BTC forecast with lows of $39,000 enabling a bullish BTC forecast 2025 of $200,000. |
| Larry Fink, BlackRock CEO | Bitcoin prediction directionally bullish, no specific price target given. |
CHECK – Our recent multi-bagger successes from 3x to 30x >>
Bitcoin Price Prediction for 2026
Bitcoin price prediction 2026 – In 2026, Bitcoin (BTC) is forecasted to trade between a minimum price of $99,910 and a maximum price of $200,000. This is a rather conservative forecast, and assumes some volatility in broad markets. In the best case outcome, Bitcoin will exceed $200,000 in 2026, assuming limited upside in the US Dollar and continued crypto adoption by institutions.
Bitcoin Price Prediction for 2027
Bitcoin price prediction 2027 – In 2027, Bitcoin (BTC) is forecasted to trade above $200,000. This bullish forecast assumes continued interest by financial institutions in crypto as an asset class. Pre-requisite: BTC clears $110,000 in 2025, and respects $74,000 by 2026.
Bitcoin Price Prediction for 2030
Bitcoin price prediction 2030 – Bitcoin is expected to hit and exceed $200,000 at a certain point before 2030. Bitcoin maximum price targets before 2030 are round numbers: $200,000 followed by $250,000.
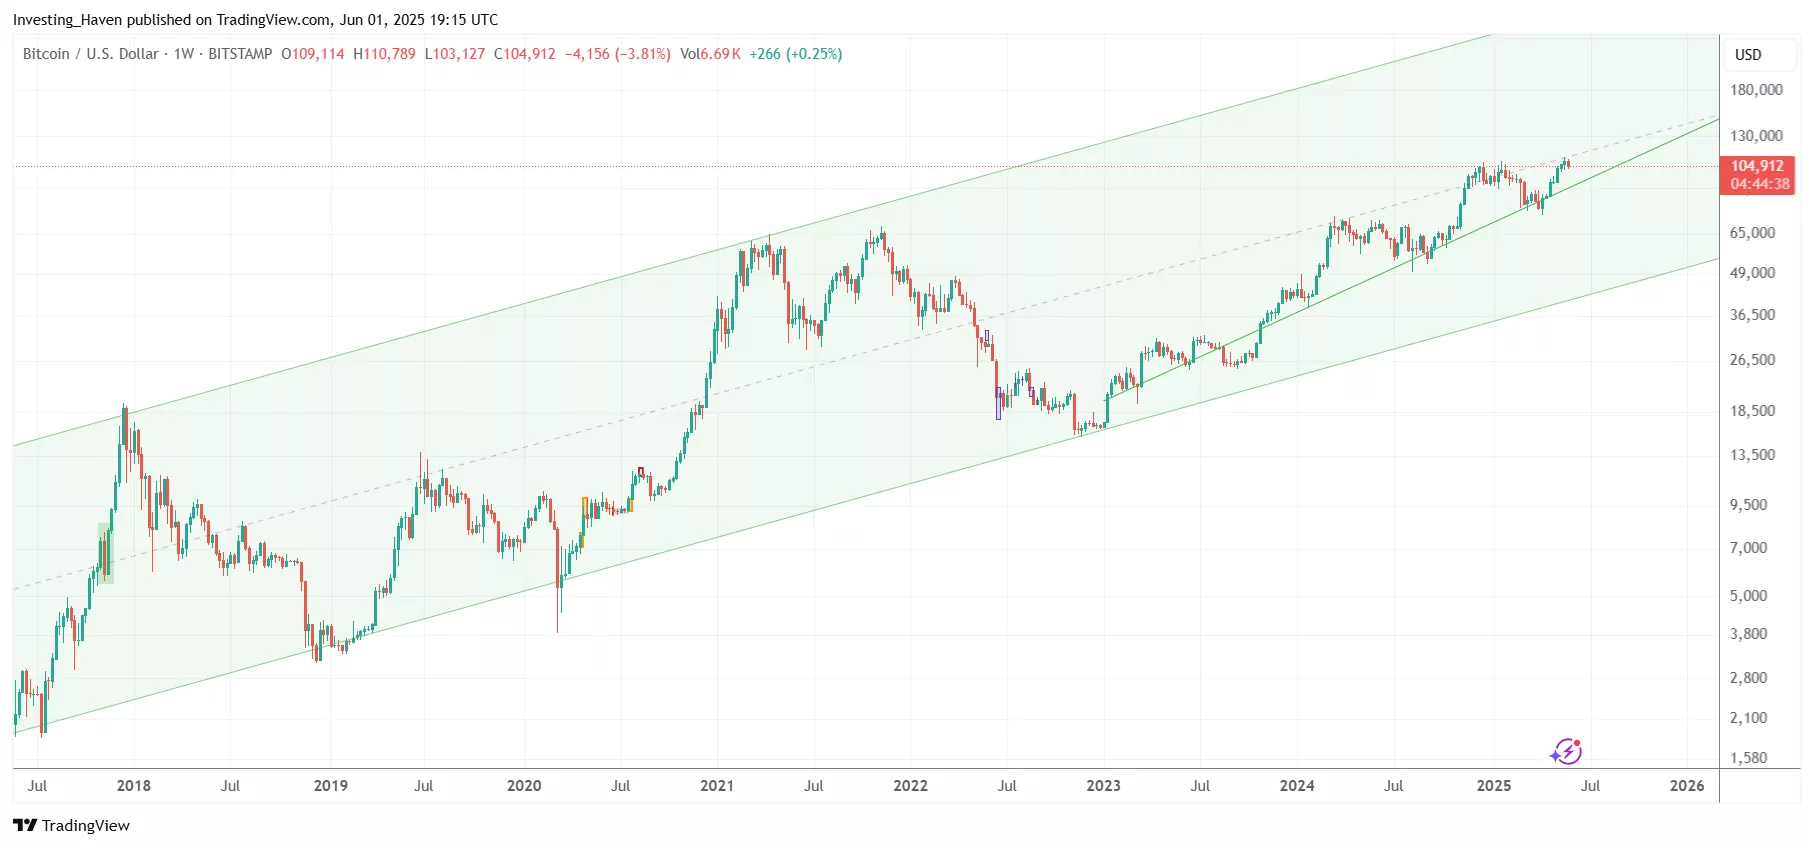
March 20th – Bitcoin consolidates just above its secular breakout at $77,000. The long-term chart indicates that $109,000 is not the rally’s end. Bitcoin’s 2030 forecasts suggest a sustained uptrend within its rising channel, pointing to continued bullish momentum.
BTC predictions from institutions
Bitcoin predictions from financial institutions that are engaged in crypto markets – obviously very bullish
Crypto-focused financial institutions are unanimously bullish on Bitcoin predictions. Many of these institutions avoid specific targets but they predict significant upside potential in Bitcoin’s price. Those with Bitcoin targets see BTC rising well above $100,000 by 2025.
Our recommendation – We advise to be mindful of bias in predictions by institutions that are fully dependent for their revenue on the crypto market.
| Specialized institutions | Bitcoin price predictions |
|---|---|
| Galaxy Digital | Bitcoin outlook directionally bullish. Bitcoin forecast up to $150,000. |
| Fidelity | Bitcoin forecast directionally bullish, no specific price target given. |
| VanEck | Bitcoin forecast directionally bullish, new all-time highs forecasted for BTC. |
| Pantera Capital | Bitcoin price prediction up to $148,000. |
| Grayscale | Bitcoin forecast directionally bullish, no specific price target given. |
| Blackrock | Bitcoin forecast directionally bullish, no specific price target given. |
| Matrixport | Bitcoin prediction suggests a drop to $45,000 enabling a bullish trend to $125,000. |
| Bitwise | Bitcoin prediction 2024 up to $80,000. |
| Bernstein | Bitcoin prediction 2025 up to $150,000. |
| Microstrategy | Bitcoin prediction 2025 up to $125,000. |
Bitcoin price predictions from traditional banks
Bitcoin predictions from traditional investment banks – it depends their crypto affinity
Bitcoin predictions from traditional investment banks vary from very bearish to mildly bullish. Some important findings:
- What is striking is that several of them are actively exploring offering Bitcoin-related services, which indicates that there is a growing interest from that group to benefit from Bitcoin’s secular uptrend.
- Banks that are not actively looking to offer crypto services tend to be much less bullish to even outright bearish.
Our recommendation – We advise to be mindful of bias in predictions by investment banks.
| Investment banks | Bitcoin price predictions |
|---|---|
| JP Morgan | Neutral to bearish with minimum Bitcoin forecast 2024 of $42,000 and Bitcoin target for 2025 of $45,000. |
| Deutsche Bank | Outright bearish with a Bitcoin forecast 2024 of $20,000. |
| Goldman Sachs | Directionally bullish BTC outlook because of institutional adoption. |
| Morgan Stanley | Directionally bullish BTC outlook because of institutional adoption. |
| Standard Chartered | Directionally bullish with a long term Bitcoin forecast of $100,000. |
BTC predictions from popular online outlets
Bitcoin predictions by popular online outlets using machine learning
The Bitcoin price prediction shared by popular online outlets typically use machine learning models:
- They don’t tend to predict a dip which is not realistic, markets don’t move in one straight line.
- Most often, it’s very hard to spot a turning point in those BTC predictions which is not convenient.
Our recommendation – We do know from experience that machine learning models have a capacity to accurately predict the short term but require a bias to predict the long term, be mindful of this also when assessing our own predictive model’s output.
| Online popular outlets | Bitcoin predictions 2025 (updated Sept 2024) |
|---|---|
| CoinDCX | Minimum $80,000 - maximum $95,000 |
| Coinpedia | Minimum $61,000 - maximum $135,000 |
| Coincodex | Minimum $60,00 - maximum $177,000 |
| 30rates.com | Minimum $52,000 - maximum $133,000 |
| Changelly | Minimum $59,000 - maximum $100,000 |
A cross-industry study of Bitcoin price predictions for 2025
| Industry participants | Bitcoin price predictions |
|---|---|
| Premium crypto forecasters | Unanimously bullish. BTC forecasted highs $80,000 to $100,000 for 2024, lows for not lower than $45,000. BTC targets 2025 up to $200,000. |
| Financial institutions specialized in crypto | Unanimously bullish. BTC forecasted around $200,000. BTC lows for 2024: potentially $40,000. |
| InvestingHaven's top forecaster | Very bullish long term with BTC target north of $150,000. Potential BTC lows for 2024 either $41,000 or slightly lower (worst case). |
| Traditional banks | Very bearish to mildly bullish. Banks with Bitcoin offerings are more bullish than their peers. |
| Popular online outlets | Potential BTC lows of 2024: $40,000. Potential BTC highs for 2024: from $78,000 to $120,000. |
Bitcoin price drop prediction
The recent drop in Bitcoin’s price was healthy because it respected key levels:
- A Bitcoin price drop will be ‘super bullish‘ if the secular breakout level at $77,000 will act as a support, preferably not touched at all.
Bitcoin’s drop in February 2025 respected $81,000 on a daily closing basis. This sends a bullish message for 2025.
| BTC price drop | Fibonacci level & outcome | Predicted probability |
|---|---|---|
| $50,882 | 25% - very bullish | High |
| $41,979 | 38.2% - bullish | High |
| $35,347 | 50% - bullish | Medium |
| $29,830 | 61.8% - bearish | Low |
| $24,666 | 75% - bearish | Low |
Bitcoin to $1 million predictions
Can Bitcoin ever hit $1,000,000?
Based on an in-depth analysis, the conclusion is that Bitcoin will not hit $1 million before 2030. It’s not realistic given the state of its blockchain (in terms of performance, speed, scalability), regulations, economic conditions, market dynamics. Moreover, the valuation of Bitcoin at $1 million is out of synch with valuation of global economies, companies, other asset classes.
Who is predicting Bitcoin to hit $1 million?
Be careful with Bitcoin to $1 million predictions. The people forecasting BTC to $1,000,000 either have no track record forecasting Bitcoin or use a thesis that is based on incorrect market dynamics. Obviously, there are forecasts made as click baits; they are not backed by a methodology nor rational framework.
Can BTC ever hit $1,00,000? Read InvestingHaven’s in-depth analysis.
Bearish Bitcoin predictions
Bearish Bitcoin price predictions
The most bearish Bitcoin prediction comes from Deutsche Bank: $20,000 this year. Other more serious analysts like Dan Dolev from Mizuho Securities predicts Bitcoin the $30,000 range. Peter Brandt rates this scenario a 25% probability but adds that a Bitcoin price drop might eventually have a very bullish outcome.
Bitcoin crash predictions
Perma-bears argue that Bitcoin will crash. They are saying so for 8 years while Bitcoin continued moving higher. Top Bitcoin crash predictions come from Nouriel Roubini, Bill Clinton’s former senior economist. Given his disastrous ‘track record’ forecasting Bitcoin, his Bitcoin crash prediction is a way to attract attention.
BTC prediction tomorrow
Bitcoin price prediction tomorrow:
Today, Bitcoin trades at 108669.37. Tomorrow, July 4, 2025, BTC is forecasted to move to 0, a change of 0.00%.
Bitcoin predictions day-by-day
Over the next 30 days, Bitcoin is predicted to see the following price range:
We are renewing the predictive model with an AI capability – day by day predictions will be back soon.
Current Bitcoin price
Bitcoin price, trading, market cap (source):
| Symbol: BTC |
| Name: Bitcoin |
| Price: $108669.36532886 |
| Circulating supply: 19886712.00000000 |
| Total supply: 19886712.00000000 |
| Volume 24h: 56412213565.16100000 |
| Percent change 1h: -0.358% |
| Market cap: 999999999999.99999999 |
Bitcoin Historical Prices
2010: The Genesis Block
Bitcoin made its debut in 2010, with its first recorded price at just $0.003 per BTC. Trading was limited, and few recognized its potential. Despite the humble beginnings, Bitcoin laid the groundwork for a revolution in digital finance. The first block was actually mined in 2009, with the words “The Times 03/Jan/2009 on brink of second bailout for banks” inscribed.
2011: Early Adoption
As awareness of Bitcoin grew, so did its price. In 2011, BTC reached parity with the US dollar, trading at around $1 per coin. The coin gained traction among tech enthusiasts and libertarians, heralding the beginning of a new era in finance. At this stage, it was viewed much like a meme coin such as Doge, with no serious potential.
2012: Price Volatility
Despite its growing popularity, Bitcoin’s price remained highly volatile in 2012. Prices fluctuated between $5 and $13 per BTC, reflecting the speculative nature of the market. However, this volatility did not deter early adopters, who saw the long-term potential of digital currency. The mainstream media was mainly hyper-critical of the token and remained that way until 2024, when it became institutionally acceptable.
2013: The Bull Run Begins
In 2013, Bitcoin experienced its first major bull run, with prices soaring to over $1,000 per BTC by the end of the year. The meteoric rise captured the attention of mainstream media and investors worldwide, sparking a frenzy of buying and speculation. However, this rapid ascent also raised concerns about the sustainability of the rally.
2014: Mt. Gox Collapse
The optimism of 2013 was short-lived – the collapse of the Mt. Gox exchange sent shockwaves through the cryptocurrency community. Prices plummeted, falling from over $1,000 to below $400 per BTC. The incident highlighted the risks associated with centralized exchanges and the need for tighter security measures in the industry. Others stated that crypto was never meant to be kept in centralized exchanges in the first place.
2015: Market Recovery
Despite the fallout from the Mt. Gox debacle, Bitcoin began to recover in 2015. Prices stabilized around $200 to $300 per BTC, as investors regained confidence in the resilience of the cryptocurrency. The focus shifted towards building a more secure and sustainable ecosystem for digital assets.
2016: Halving Hype
The Bitcoin halving in 2016 generated renewed interest in the cryptocurrency, as supply dynamics came into focus. Prices started to climb, reaching over $700 per BTC by the end of the year. The event underscored Bitcoin’s deflationary nature and its appeal as a store of value in an uncertain economic landscape.
2017: The Year of the Bull
2017 was a watershed moment for Bitcoin, as prices surged to unprecedented heights. BTC reached an all-time high of nearly $20,000 per coin, driven by a perfect storm of institutional interest, retail FOMO, and mainstream adoption. However, the rapid ascent also led to concerns of a potential bubble and regulatory crackdown. The same day that futures were launched on major exchanges, BTC prices fell, leading some to cite insider trading and fraudulent activities..
2018: The Crypto Winter
The euphoria of 2017 was short-lived, as Bitcoin entered a prolonged bear market in 2018. Prices plummeted, falling below $4,000 per BTC, as regulatory uncertainty and investor fatigue took their toll. The ICO industry was also rife with hacks and scams, which scared away some of the more influential investors.
2019: Signs of Recovery
Despite the challenges of the previous year, Bitcoin showed signs of resilience in 2019. Prices gradually recovered, climbing back above $10,000 per BTC by mid-year. Institutional interest also began to grow, with major corporations and financial institutions exploring the potential of digital assets. The stage was set for a new chapter in Bitcoin’s evolution.
2020: The Halving Effect
The Bitcoin halving in May 2020 once again captured the attention of the market, as supply issuance was cut in half. Prices surged, surpassing $20,000 per BTC by the end of the year, fueled by a combination of institutional adoption and macroeconomic uncertainty. With COVID-19 well underway, the value of BTC as a hedge against inflation was a contributor to its growth.
2021: Institutional Adoption
In 2021, Bitcoin cemented its status as a mainstream asset class, as institutional adoption reached new heights. Prices surged to over $60,000 per BTC, driven by corporate treasuries, investment funds, and billionaire investors. It also prompted other coins to rise in value, as this was the best-performing year for the wider crypto industry. However, regulatory scrutiny and environmental concerns also emerged as key challenges for the cryptocurrency industry. One study in particular about BTC using more electricity than most countries did a lot of reputational damage.
2022: Market Correction
After the euphoria of 2021, Bitcoin faced a market correction in 2022, as prices retreated from their all-time highs. Prices fluctuated between $30,000 and $50,000 per BTC, reflecting a more cautious sentiment among investors. The pullback was seen as a healthy consolidation after the rapid gains of the previous year, providing opportunities for long-term investors to accumulate. As we have always stated at IH, market corrections are wonderful buying opportunities – assets are not going to rise in a straight line forever.
2023: Resilience and Adaptation
Despite the challenges of the previous year, Bitcoin continued to demonstrate resilience in 2023. Prices stabilized around $40,000 to $60,000 per BTC, as the cryptocurrency found support from institutional investors and retail traders alike. The focus shifted towards addressing scalability and sustainability concerns, laying the groundwork for future growth and adoption. The narrative that Bitcoin was a fringe asset had finally died off, and even TradFi investors like Jamie Dimon and Warren Buffet had to reevaluate their assessments.
2024: Bullish Breakout Confirmation
Bitcoin solidified its bullish breakout in 2024, maintaining prices between $36,000 and $75,000. Institutional adoption grew, and mainstream acceptance cemented its position as a core portfolio asset. The year marked the end of the “fringe asset” narrative, as even skeptics acknowledged Bitcoin’s resilience and long-term potential.
Bitcoin 2025 FAQs
Is Bitcoin a good investment in 2025?
Bitcoin’s dominance is astonishing. Bitcoin beats most other cryptocurrencies in terms of recent performance, in early 2025. Bitcoin’s longest term price history shows outperformance. This confirms that BTC should be a good investment opportunity in 2025.
How much will Bitcoin be worth in 2025?
Bitcoin’s predicted value is calculated based on its average predicted price in 2025. With predicted lows of $75,550 and highs of $125,000, the average forecasted BTC price for 2025 is $100,000. This value is subject to change; it will rise if BTC surpasses $100k for 8 consecutive days.
Will Bitcoin rise in 2025?
Bitcoin is expected to hit support levels in early 2025. When considering the average predicted price for Bitcoin in 2025, the expectation is that Bitcoin eventually will rise beyond $100k. Bitcoin’s predicted rise in 2025 will be confirmed once BTC clears $100k for at least 5, 8, 13 days.
What price may Bitcoin reach in 2025?
According to predictive research, Bitcoin is expected to hit a maximum price point in 2025 of $125,000. However, this may be a conservative price target. The most aggressive though still realistic BTC price targets for 2025 are in the $150,000 area.
Bitcoin prediction FAQs until 2030
Will Bitcoin go up or down?
BTC is expected to complete its 2025 price drop in the period mid-March to mid-April. It should continue higher in 2025, as of May 2025. This prediction is derived from several respected industry analysts. It’s also a contrarian forecast, certainly not based on a simplified HODL strategy.
What will Bitcoin be worth in 2030?
Predictive BTC research suggests that Bitcoin may continue to rise, and reach levels north of $200,000 by 2030. BTC may clear our most bullish target of $250,000 by 2030. The $500,000 price point seems unrealistic; in the very best case outcome BTC might briefly touch $500k before 2030.
Will Bitcoin ever hit $1 million?
Not this decade, definitely not! Bitcoin might hit $1 million after 2030, potentially. If BTC would trade at $1,000,000 its market cap would be nearly $15 trillion which is simply impossible to happen unless extraordinary market conditions would occur. Investors better don’t count on a Bitcoin price prediction of $1 million.
How much is Bitcoin worth today?
Today, Bitcoin is worth $108669.37. This is the average price of BTC in the last 24 hours, today on July 3, 2025. Tomorrow, per predictive research, BTC is forecasted to be worth $0.
Disclaimer: The information presented in this article is for informational purposes only and does not constitute financial or investment advice. All opinions are those of the author and should not be interpreted as specific trading or investment recommendations. We do not guarantee the completeness, accuracy, or reliability of this content. Cryptocurrency markets are highly volatile and can experience unpredictable fluctuations. Readers are encouraged to conduct their own research, consider multiple perspectives, and understand local regulations before making any investment decisions.
