Investing Haven
No Result
View All Result
Gold Silver Investing >>
CRYPTO INVESTING >>
  • 2025 Forecasts
    • 10 market predictions
    • Dow Jones forecast
    • S&P 500 forecast 2025
    • Nasdaq prediction 2025
    • Best altcoins to buy
    • Best crypto to buy now
    • Which crypto will explode
    • 15 crypto forecasts 2025
    • Which precious metal to buy
  • Silver
    • Silver prediction 2025 – 2030
    • Will silver exceed $30?
    • When will silver hit $50?
    • Can silver hit $100?
    • Silver shortage
    • 50-year silver chart
    • Silver bullish reversal
    • Silver seasonality charts
    • How to invest in silver
  • Gold
    • Gold prediction 2025 – 2030
    • Will gold set new ATH?
    • Will gold hit $3,000?
    • Can gold hit $10,000?
    • Gold chart 10 years
    • Gold chart 50 years
    • Gold chart 100 years
    • Gold silver ratio
    • Gold seasonality charts
  • Commodities
    • Coffee forecasts
    • Sugar forecasts
    • Nickel forecasts
    • Lithium investing
  • Crypto forecasts
    • BTC prediction 2025 – 2030
    • ETH prediction 2025 – 2030
    • SOL prediction 2025 – 2030
    • XRP prediction 2025 – 2030
    • XLM prediction 2025 – 2030
    • BNB prediction 2025 – 2030
    • ADA prediction 2025 – 2030
    • AVAX prediction 2025 – 2030
    • KAS prediction 2025 – 2030
    • NEAR prediction 2025 – 2030
    • BCH prediction 2025 – 2030
    • LINK prediction 2025 – 2030
    • DOT prediction 2025 – 2030
    • SUI prediction 2025 – 2030
    • ICP prediction 2025 – 2030
    • LTC prediction 2025 – 2026
    • STX prediction 2025 – 2030
    • DOGE prediction 2025 – 2030
    • SHIB prediction 2025 – 2030
    • PEPE prediction 2025 – 2030
    • FLOKI prediction 2025 – 2030
    • WIF prediction 2025 – 2030
    • ONDO prediction 2025 – 2030
  • News
    • Crypto news
    • Commodities
  • Login
Investing Haven
No Result
View All Result

Home » Crypto & Blockchain » Historic Moment: Ethereum’s Longest Trendless Period in History

Historic Moment: Ethereum’s Longest Trendless Period in History

Taki T. by Taki T.
July 28, 2023
in Crypto & Blockchain
ethereum price forecast
1.9k
VIEWS
Share on FacebookShare on Twitter

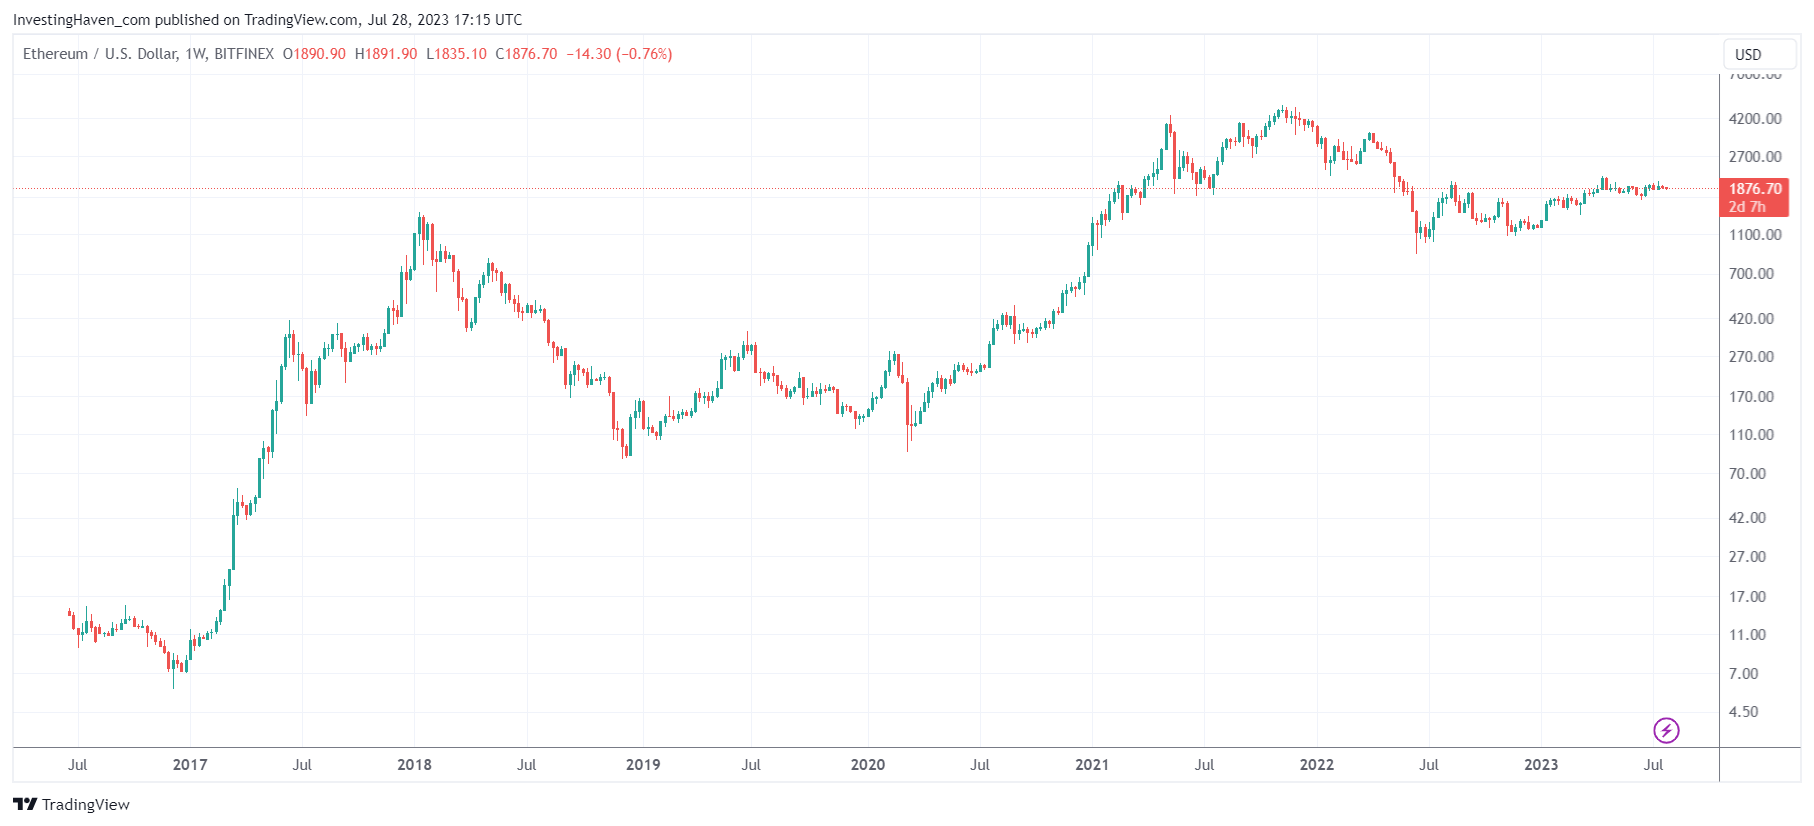
Ethereum is trading at the exact same level where it was mid-March. Not only has Ethereum (ETH) barely moved in 4 months time, its volatility level has come down to historically low levels. Being invested in Ethereum may feel very boring. When we look at Ethereum top-down we observe the longest ‘trendless period’ in its history. We focused on the shorter timeframe in one of our recent writing Ethereum Consolidating For 6 Months: Good Or Bad but will put those findings in perspective in this blog post.

Note that XRP may have written history a few weeks ago but it was one of the few exceptions in the crypto universe. It was a very eventful month for XRP. As said, we remain very bullish long term with an XRP forecast of 10 USD because XRP’s beautiful long term crypto chart.

XRP cannot be compared to Ethereum, both have gone through very different cycles. We are not here to compare both, but we want to emphasize that XRP’s recent price action is not reflecting ongoing dynamics in the crypto market. In fact, Ethereum is much more reflecting crypto market trends nowadays.

This brings up the question when crypto will experience its ‘golden weeks‘.

Let’s verify the charts, in a top-down approach, in order to understand if the charts can answer the question(s) outlined above.

First of all, if we look at the weekly chart, since 2016, we can see how trendless ETH is. In fact, since April 14th, ETH turned completely trendless, as if it discontinued trading. Never before have we seen ETH, completely paralyzed, for 3 full months.

In terms of chart structure, we can see how this trendless period is starting to morph into a long basing pattern. Remember, the longer the stronger, is what applies to base building structures on any chart.

ETH price chart weekly

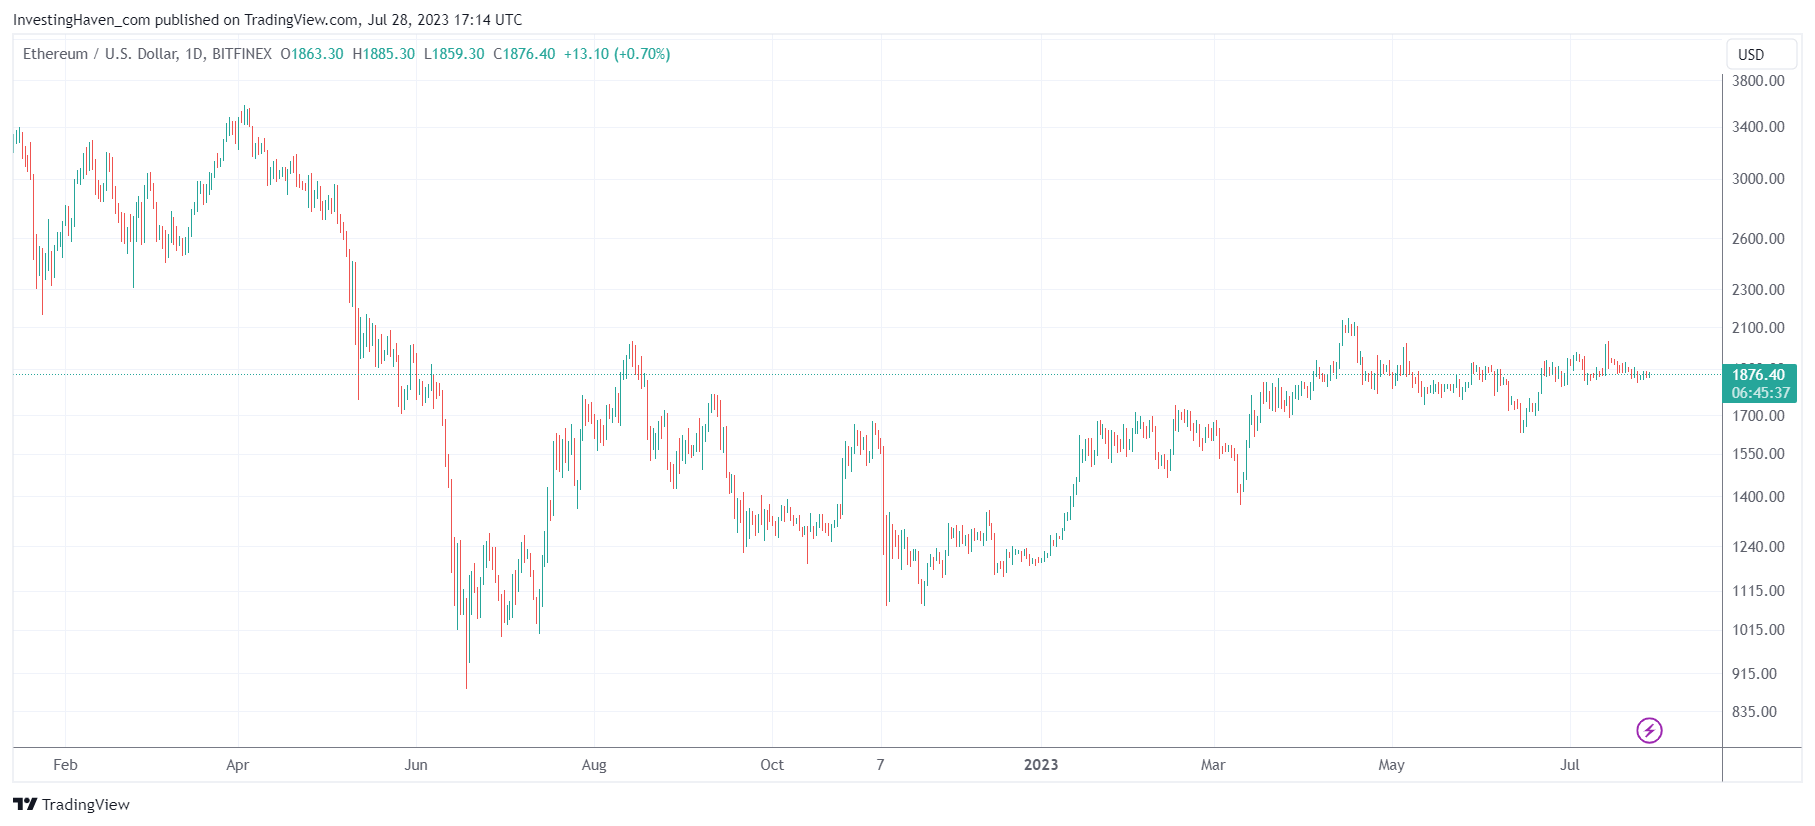
This is what ETH looks like if we zoom in. Needless to say, a chart without annotations is what anyone can create, what’s so special about these charts? Well, it pays off, from time to time, to look at a chart without annotations. The point is to figure WHEN exactly it makes sense to look at a ‘vanilla chart’, we believe it is now.

The daily ETH chart shows large moves, wild swings, a year ago. The reversals became milder and softer, in 2023. This should be a good thing for the long term.

ETH price chart daily

Short to medium term, though, we stick to the findings we discussed recently. The long consolidation is occurring right below the 50% retracement level since ETH hit its ATH. This is what we wrote recently:

In terms of resistance, it is blatantly clear how powerful resistance is right at the 50% retracement level (between its ATH and June 2022 lows), see the fine purple line on the chart. In August of 2022 as well as April of 2023, the 50% retracement level was tested. In the former situation, it resulted in a big drop. In the latter situation, we got a much softer drop.

When we overlay our annotations to the ETH chart, we see the 50% retracement level coinciding with the fine purple line.

ETH price chart daily

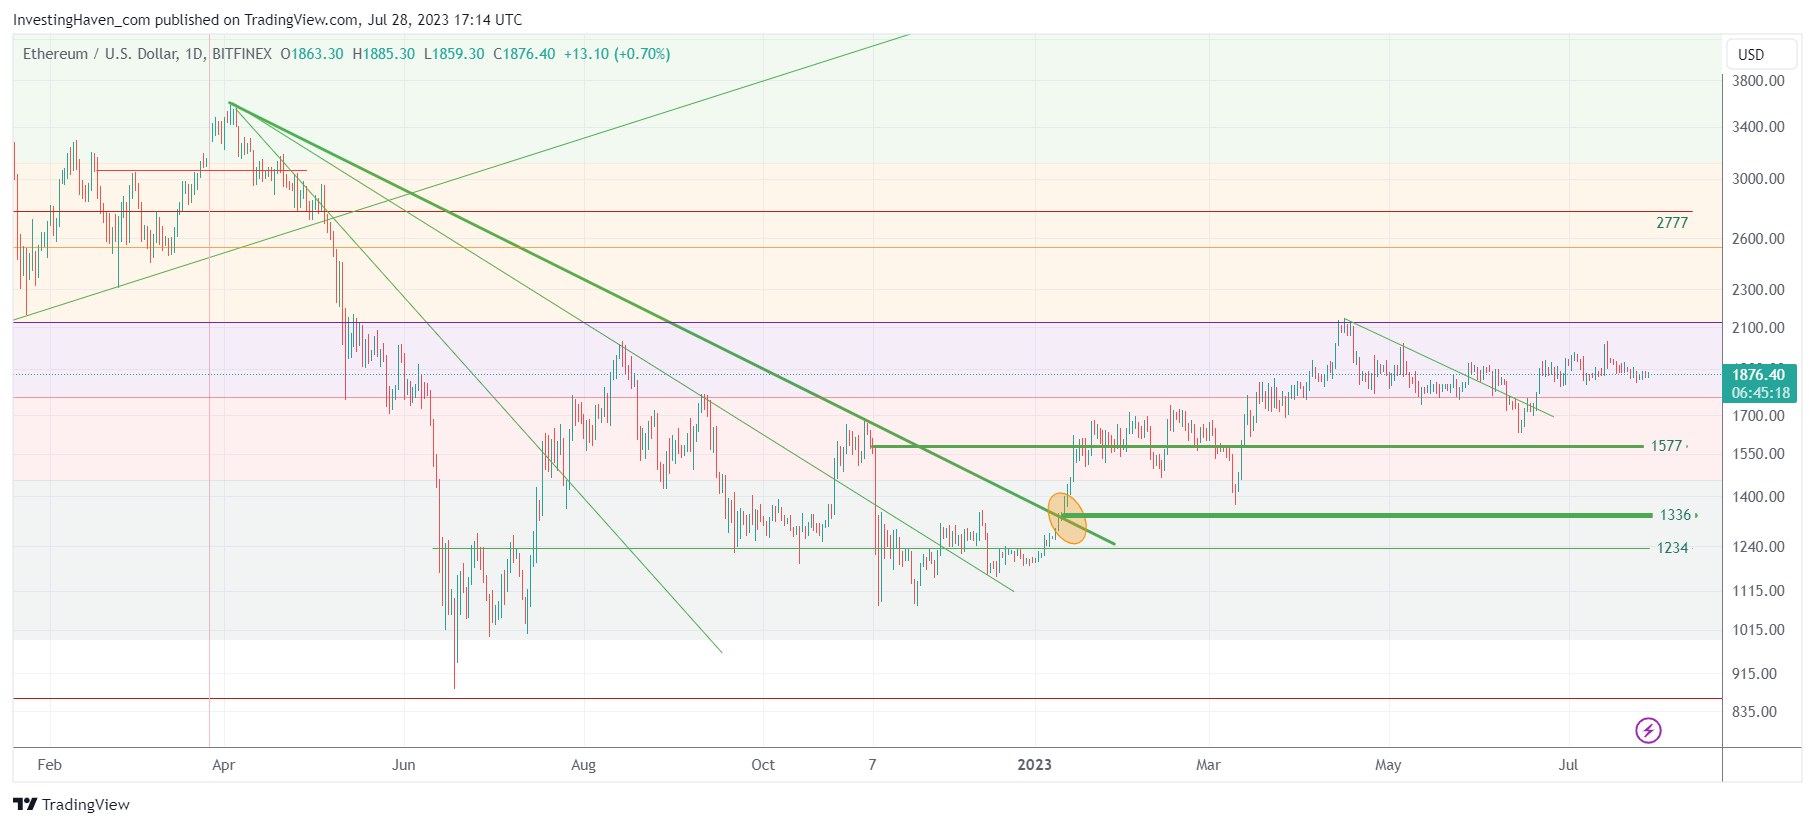
In sum, it remains clear that (a) a long consolidation is a good thing (b) ETH won’t be able to create bullish momentum as long as it continues to trade below 2k USD (c) a trendless state may help the long term chart structure even though it is really boring as an experience for investors in the short to medium term.

Also, if a market cannot move higher, it will likely move lower first. ETH might drop to 1555 USD, in September, unless it is able to clear 2k USD in August. In relative terms, it would still be a tiny drop if it were to occur.

In the meantime, crypto enthusiasts can check out the crypto segment that is set up for outperformance whenever bullish momentum hits the crypto sector. Read our latest in-depth crypto report 30 cryptocurrencies in 7 segments: which tokens are ready for a move?


10-YEAR ANNIVERSARY OFFER: InvestingHaven.com celebrates 10 years. Temporarily, you can enjoy a discount on our premium gold/silver and crypto reports. Or you can become a VIP member. Go to our anniversary deals >>
Receive our FREE crypto predictions alerts

Download 50 crypto investing tips

 premium service crypto teaser premium service SP-500

Related posts:

  1. 15 Cryptocurrency Forecasts For 2025
Tags: Ethereum
Taki T.

Taki T.

Taki is a chart analyst who is passionate about unlocking unique insights out the chart. While the vast majority of analysts remain focused on price analysis, Taki starts with timeline analysis and adds price analysis to this. In doing so, he developed a unique methodology to find opportunities in financial markets, across assets and markets.

Connect with InvestingHaven

Receive top notch forecasts for free.

*We hate spam as you do.

Site Navigation

  • RSS Feed
  • About us
  • Advertising
  • Sponsored Content Policy
  • Mission 2026
  • Sitemap
  • Privacy & Disclaimer
  • Terms of Service
  • Contact Us
investing haven logo

Precious metals market analysis including gold and silver price predictions. Crypto market analysis including highly accurate BTC ETH SOL XRP forecasts.

Copyright © 2025 InvestingHaven

Login to your account below

Forgotten Password?

Fill the forms bellow to register

All fields are required. Log In

Retrieve your password

Please enter your username or email address to reset your password.

Log In

Receive our FREE crypto predictions alerts

Download 50 crypto investing tips
No Result
View All Result
  • News
  • 2025 Forecasts
    • 10 market predictions
    • Dow Jones forecast 2025
    • S&P 500 forecast 2025
    • Nasdaq prediction 2025
    • Best crypto to buy now
    • Which crypto will explode
    • Best altcoins to buy
    • 15 crypto forecasts 2025
    • Which precious metal to buy
  • Silver articles
    • Silver prediction 2025 – 2030
    • Will silver exceed $30?
    • When will silver hit $50?
    • Can silver hit $100?
    • Silver shortage
    • 50-year silver chart
    • Silver bullish reversal
    • Silver seasonality charts
    • How to invest in silver
  • Gold
    • Gold prediction 2025 – 2030
    • Will gold set new ATH?
    • Will gold hit $3,000?
    • Can gold hit $10,000?
    • Gold chart 10 years
    • Gold chart 50 years
    • Gold chart 100 years
    • Gold silver ratio
    • Gold seasonality charts
  • Commodities
    • Sugar forecasts
    • Coffee forecasts
    • Nickel forecasts
    • Lithium investing
  • Crypto news
  • Crypto forecasts
    • BTC prediction 2025 – 2030
    • ETH prediction 2025 – 2030
    • SOL prediction 2025 – 2030
    • XRP prediction 2025 – 2030
    • XLM prediction 2025 – 2030
    • BNB prediction 2025 – 2030
    • ADA prediction 2025 – 2030
    • AVAX prediction 2025 – 2030
    • KAS prediction 2025 – 2030
    • NEAR prediction 2025 – 2030
    • BCH prediction 2025 – 2030
    • LINK prediction 2025 – 2030
    • DOT prediction 2025 – 2030
    • SUI prediction 2025 – 2030
    • ICP prediction 2025 – 2030
    • LTC prediction 2025 – 2026
    • STX prediction 2025 – 2030
    • DOGE prediction 2025 – 2030
    • SHIB prediction 2025 – 2030
    • PEPE prediction 2025 – 2030
    • FLOKI prediction 2025 – 2030
    • WIF prediction 2025 – 2030
    • ONDO prediction 2025 – 2030
  • Premium Crypto Alerts
  • Premium services

Copyright © 2025 InvestingHaven

×