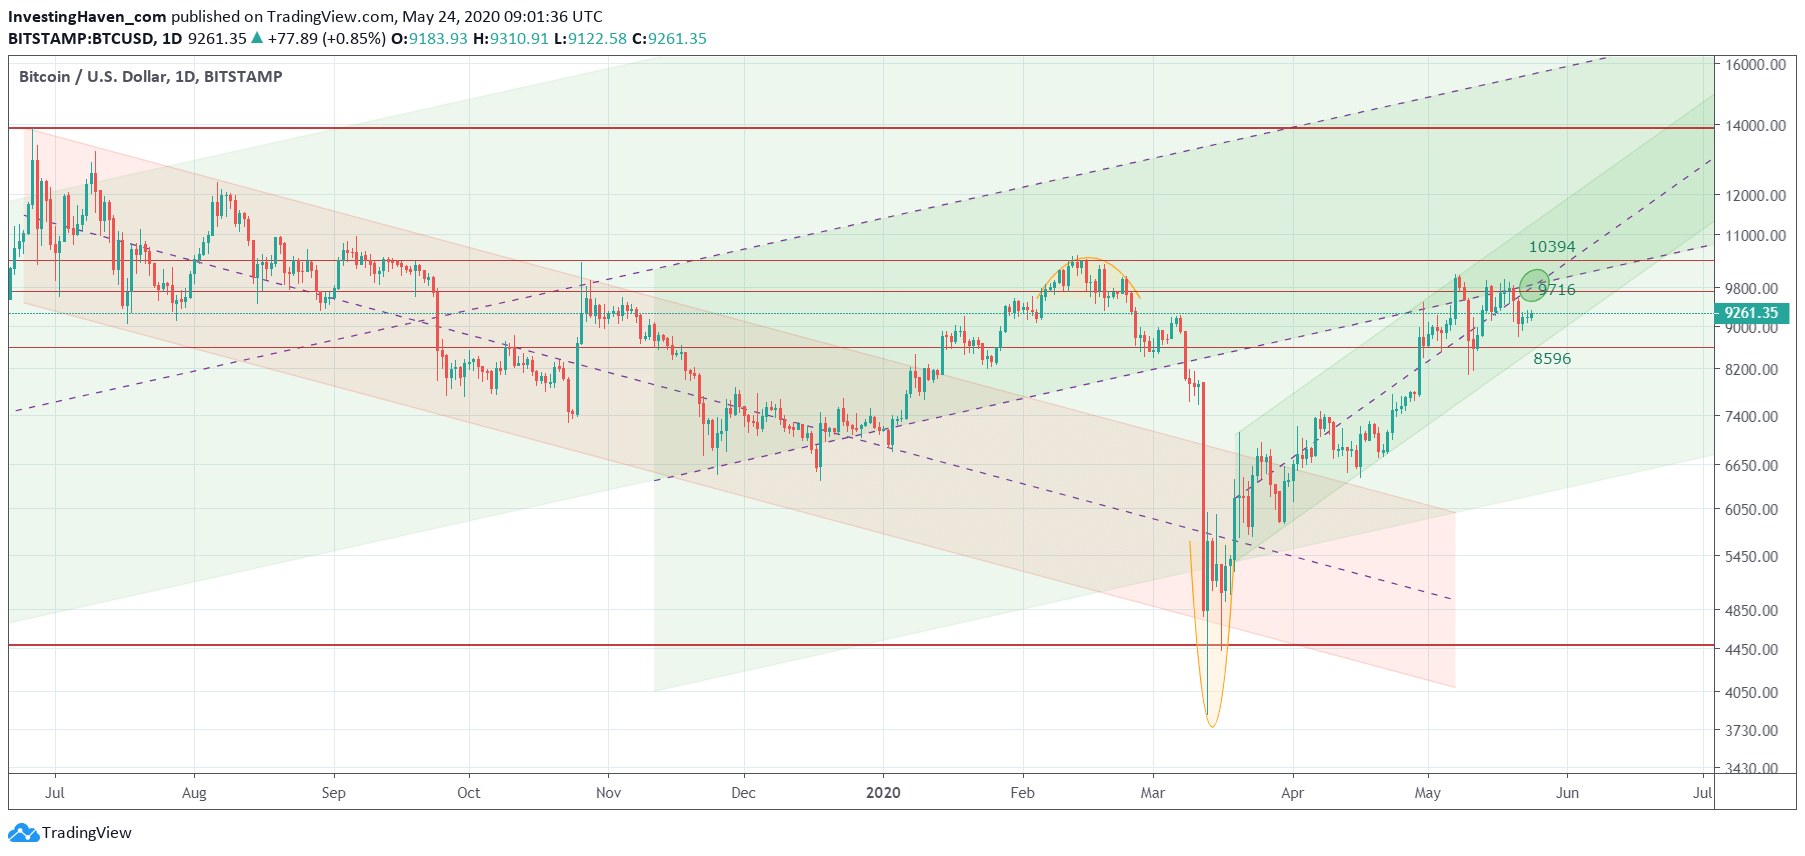
It is Sunday, the usual day for Bitcoin to show weakness. It is a recurring pattern: Sunday evening in Asia, Sunday afternoon in Europe, Sunday morning in the U.S. … and crypto markets are getting sold driven by Bitcoin weakness. Mysterious pattern. Regardless of short term price action we want to focus on the bigger picture trend. Our current Bitcoin forecast is that BTC trades at a very important pivot point, as explained in great detail today to our crypto premium members. The next 72h will be decisive. We explained why, how to identify this in the chart and which predictive information the current chart setup has. All this is available to our premium crypto members.
We cannot share the exclusive charts we sent in today’s crypto alert to our members. It contains information and insights that are too valuable.
However, what we can share in the public domain is the daily BTC chart, and the ongoing pattern that it shows.
Clearly, BTC is moving in a strongly bullish rising channel. No doubt about this, and everyone with some basic charting skills can identify this.
The important insight from this chart, though, is that BTC is stuck between 8.6k and 9.8k. A trading range (consolidation) within an uptrend is tricky, and requires watching. The bullish bias is still there in crypto markets, but the rising trend needs to be respected.
What can happen going forward?
The bullish trend may bring BTC back to the 2019 highs around 14k. This would make sense as the 14k level test would be a regular breakout test. It would be a regular move within the ‘canvas’ that BTC created on its chart, see below.
The bearish scenario would kick in once BTC falls below its current rising channel. It would result in selling that might bring BTC back to 7.4k (if not 6.9k). In that scenario BTC would start a longer consolidation period in the canvas shown below.


