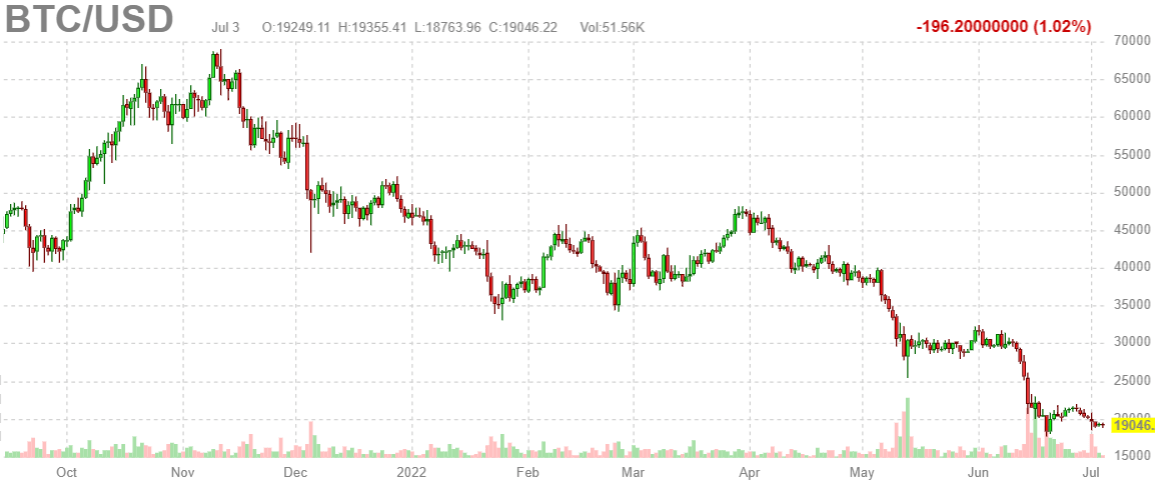
Last week, we looked at Bitcoin’s bounce pointing out that a re-test of the 19-20k lows would be a very natural outcome of the chart setup. At the time of writing, BTC is doing exactly that, since a few days in fact.
We said before that we work with 6 distinct BTC charts in our crypto investing service in order to assess the trend and future trends of Bitcoin. Although we have plenty of charts to choose from, we will use the most basic version of a BTC chart (from Finviz).
Last week, we made 2 important points. All three of them are still very relevant and will continue to be relevant throughout the month of July:
- BTC has been in a slow decline whereas the drop since June 10th was the fastest drop since the start of the bearish trend back in December. Consequently, a V shaped recovery is not likely.
- From a chart perspective, the price points set on June 18th and the 3 days that followed are crucially important, not just for the month of July but for many more months to come!
With that said, let’s use the most basic version of a chart just to be sure that we stay focused on the 2 points made above.
The price points set on June 18th were 19k and 20k.
As we can see on the BTC chart those price points are thoroughly tested currently.
What looks very promising is that volatility is completely gone. This should prevent BTC from another steep decline. In fact, as long as BTC continues to trade above 20k on a daily closing basis it might be setting up for a summer rally, is what we said in in our crypto investing service (although we used more detail and will continue to do so as we guide our members in these really uncertain times).


