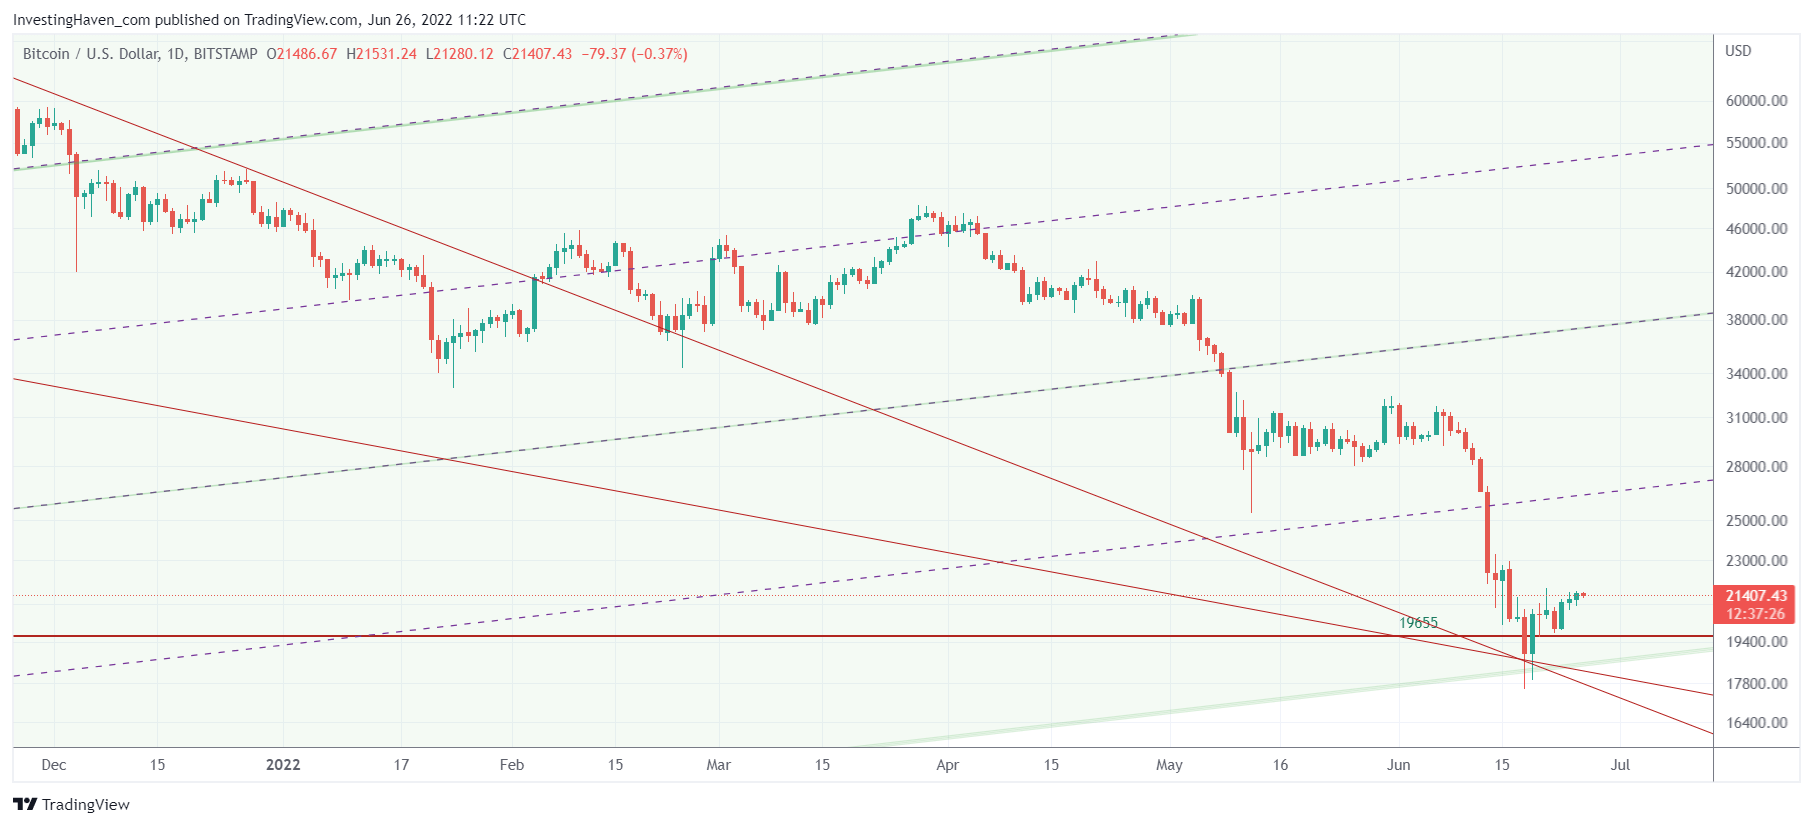
Exactly one week ago, Bitcoin managed to end its freefall drop. On Saturday, June 18th we witnessed this really sharp drop but one day later we got a larger green candle. That’s a clear invalidation setup which we mentioned in Bitcoin Price Outlook Following Last Weekend’s Crash. Given the really slow decline in BTC in the last 6 months we don’t expect a V shaped recovery. the most likely outcome is a bottoming formation with a double to triple bottom, provided the recent lows will hold.
The daily BTC chart says it all. In fact, we analyze the direction of the crypto market based on 6 distinct BTC charts in our crypto investing service. One of the 6 of them is shown below and it has a few really relevant insight.
First of all, we can clearly see how BTC has been in a slow decline whereas the drop since June 10th was the fastest drop since the start of the bearish trend back in December.
We believe, because of this, that a V shaped recovery is not likely. The Corona crash came with a fast decline and fast recovery, a true V shaped reversal. Both situations are vastly different.
Second, the longest term channel on the BTC chart got tested last Saturday. It did hold. A re-test of the lows of the +10 year channel should not be discounted.
Third, from a chart perspective, it was pretty fascinating to see how price got to the intersection of 3 hugely important trendlines, exactly on June 18th. As an investor, it was super scary. Chart-wise, it was fascinating. That’s the combination that matters for important reversals to be created.
Going forward, we believe that 19-20k will be crucial. A back-test, maybe even multiple of them, should not be excluded. In fact, we feel strongly about at least one back-test of the recent lows, due next week. Whatever happens in the 19-20k area will be crucial for the long term trend in BTC and crypto markets. It will also determine whether we can expect a summer rally. More charts and precise price points in today’s crypto alert >>


