Our Dow Jones forecast for 2021 is strongly bullish. We expect the Dow Jones to hit 32,000 points in 2021. We forecast lots of volatility as the Dow Jones will be testing the 32k area, presumably near the end of 2021 or in 2022. Investors should get the maximum out of the bullish potential from our Dow Jones forecast for 2021. Note that this another critical piece in our annual series of forecasts because it paints a very clear picture of our general market forecasts for 2021: bullish stock market (not only this bullish Dow Jones forecast but all U.S. stock indexes), bullish on several commodities, strongly bullish crypto markets.
[August 2021 update. Please scroll down for the most up-to-date Dow Jones charts: 100 years, 20 years and 1 year.]
[Thorough update on 10.25.20. Please scroll down to find the most up-to-date Dow Jones forecast for 2021.]
[Post Corona Crash Update posted on 08.23.20. Please scroll down to find the most up-to-date Dow Jones forecast with post Corona crash charts.]
[Corona Crash Update posted on 04.27.20. Please scroll down to find the most up-to-date Dow Jones price charts for April 2020, one month after the Corona crash lows, with Corona crash charts.]
[Corona Crash Update posted on 03.27.20. Please scroll down to find the most up-to-date Dow Jones chart as well as insights to our forecasts after the Black Thursday and Black Monday crashes in March of 20′.]
Why This Dow Jones Prediction?
What we are really interested in is to understand whether the stock bull market is the place to be invested in for 2021. We want to be invested in bull market trends, and the Dow Jones prediction will help with this.
As said before we are on the lookout of markets that become a multi bagger in 6 to 9 months time. We committed before on this: Forecasting The 3 Top Opportunities Per Year Becomes InvestingHaven’s Mission. If we get the high level trend right we can know in which direction to look for these extraordinary returns.
Based on the elements in this article we conclude that the likelihood of stock markets moving higher in 2021 and 2021 is high. Our Dow Jones prediction is bullish for 2021. This implies that we can reasonably expect decent returns in stock markets.
We strongly recommend readers to subscribe to our free newsletter as we will be publishing those high potential multi-baggers that we identify in 2021.
Dow Jones Forecast For 2021
Our forecast for the Dow Jones is bullish for 2021! We predict 32,000 points in the Dow Jones in 2021 after which we have to re-assess the situation based on intermarket capital flows.
This Dow Jones forecast for 2021 is based on our 2 leading indicators: Treasury rates as well as the Russell 2000. The first one says that ‘risk on’ is returning to markets, the other one was ‘risk on’ is starting as soon as the Russell 2000 index crosses 1625 points.
We mapped the consistent message from our 2 leading (risk) indicators to the Dow Jones charts in a top down approach. The quarterly chart confirms the monthly and weekly. This suggest a very high level of reliability.
All data points confirm that ‘risk on’ is returning going into 2021. We expect a strongly bullish 2021 as it will be the year the world starts going ‘back to normal’.
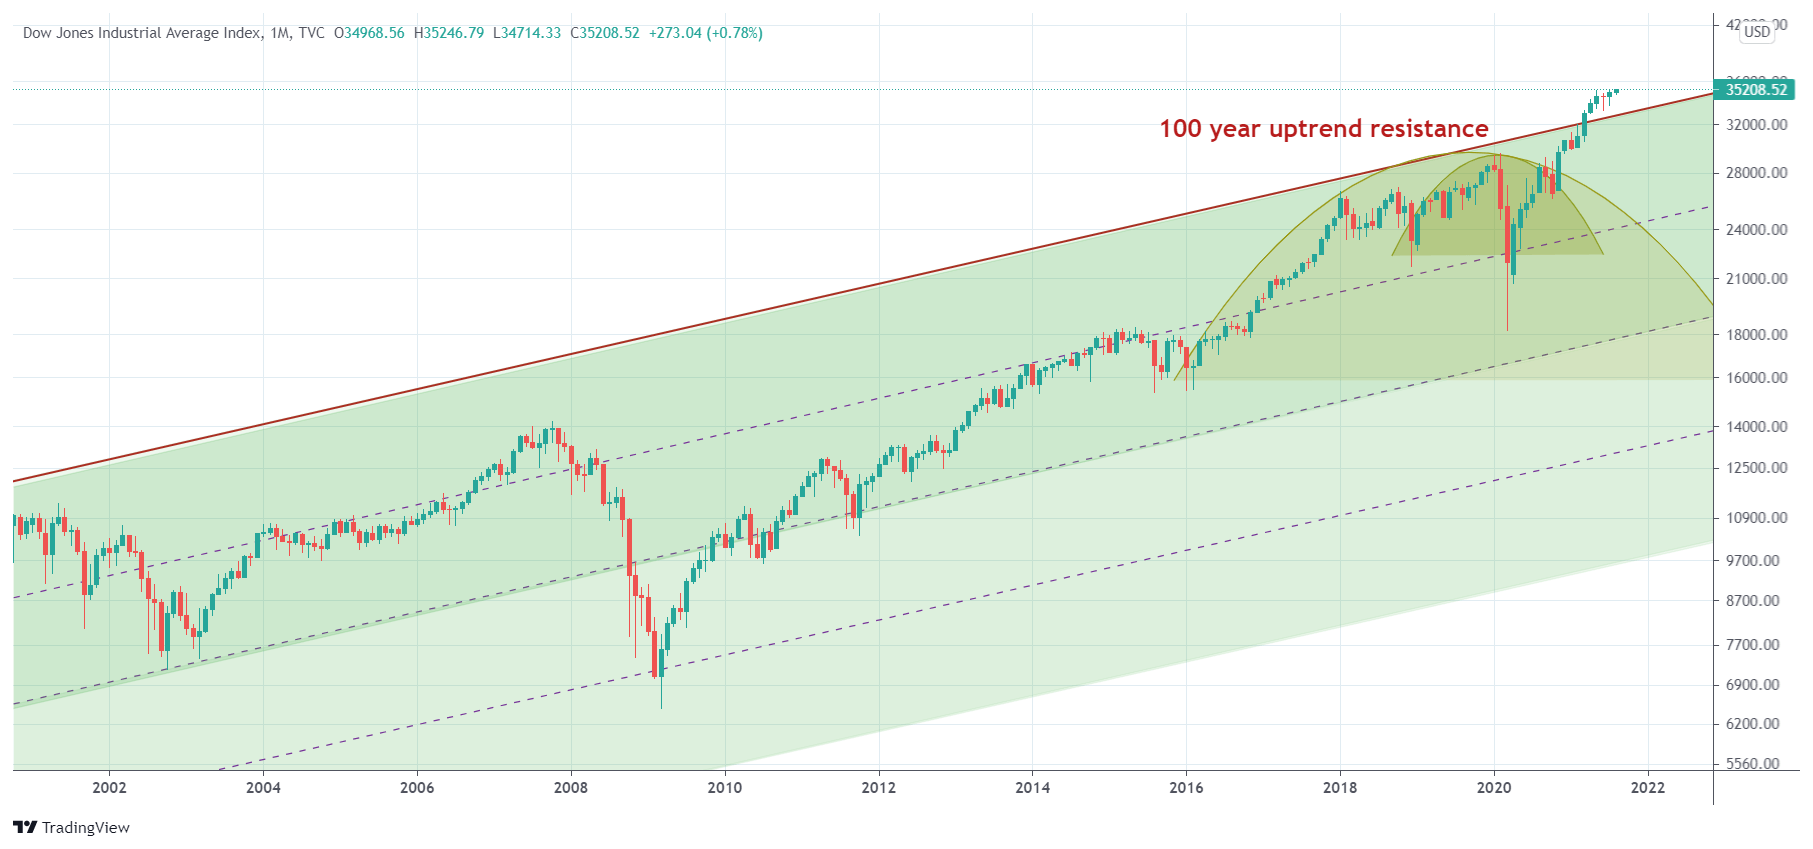
Some must-see historic charts: 100 year #dowjones charts. A 100 year breakout was confirmed in July of 2021. Previously, similar breakout tests resulted in mega crashes of 1929, 2000 and 2020. #charting Click To Tweet
However, watch out after this bullish cycle. Near the end of 2021 or in 2022 we will see Dow Jones hitting resistance of a 100 year bull market channel. We expect some big volatility in that area!
Dow Jones Predictions For 2021
Based on the leading indicators (or lack thereof) and more importantly the chart setup we see the following Dow Jones forecast for 2021.
This is our forecasted Dow Jones price for the coming years.| Year | Dow Jones forecast | Conditions | Invalid |
|---|---|---|---|
| 2020 | Strongly bullish | Russell 2000 breaks above 1625 points. | Russell 2000 remains below 1625 points near year-end. |
| 2021 | Strongly bullish | Russell 2000 breaks above 1625 points. | Russell 2000 remains below 1625 points. |
| 2022 | Strongly bearish | Top of the 100 year channel is tested | Rates break out of their 40 year falling channel |
Leading Indicator #1 For Our Dow Jones Forecast
As per our investing method we work with leading indicators for our forecasting. Note that each market has different leading indicators, there is no one-size-fits-all, unfortunately.
The first leading indicator for our Dow Jones forecast is 20 year Yields. This looks very bullish for stocks, and is supportive of a bull market in stock markets in general and the Dow Jones in particular.
How exactly does this leading indicator correlate to the Dow Jones index?
Pretty simple, rising rates suggest rising risk appetite among investors. That’s because of the inverse relationship between rates and bonds: the higher rates the lower the prices of bonds as investors flow into higher risk investments.
The long term (monthly) chart of 20-year Treasury rates shows a very clean and clear picture. Rates went through a crash of some 45 pct between October 2018 and September 2019 (a 12 month period). Rates fell back to their 2016 lows. With the Corona crash they set an all time low as they fell through their multi-decade channel.
Rates are set to stop falling and move higher from here. This is an ideal set up for stock markets in general and the Dow Jones in particular!
First area of resistance is coming close, there will be some hesitation at that point. As the world will gradually be moving ‘back to normal’ in 2021 we expect rates to get back into their long term channel. This, if materialized, will be good for stocks and the Dow Jones in 2021.
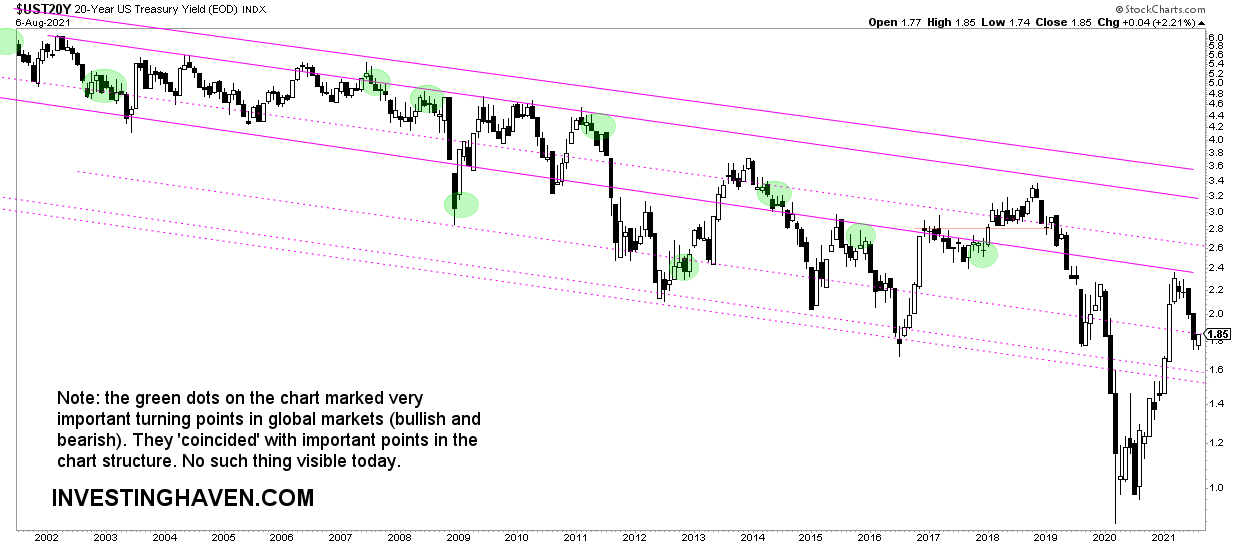
Chart update: August 8th, 2021
If we switch from 20-year Treasury rates (chart above) to 10-year Treasury rates (chart below) we see an even clearer picture.
In essence the 10-year Treasury rates chart just confirms with even more detail and confidence levels our observation from the 20-year Treasury rates chart above.
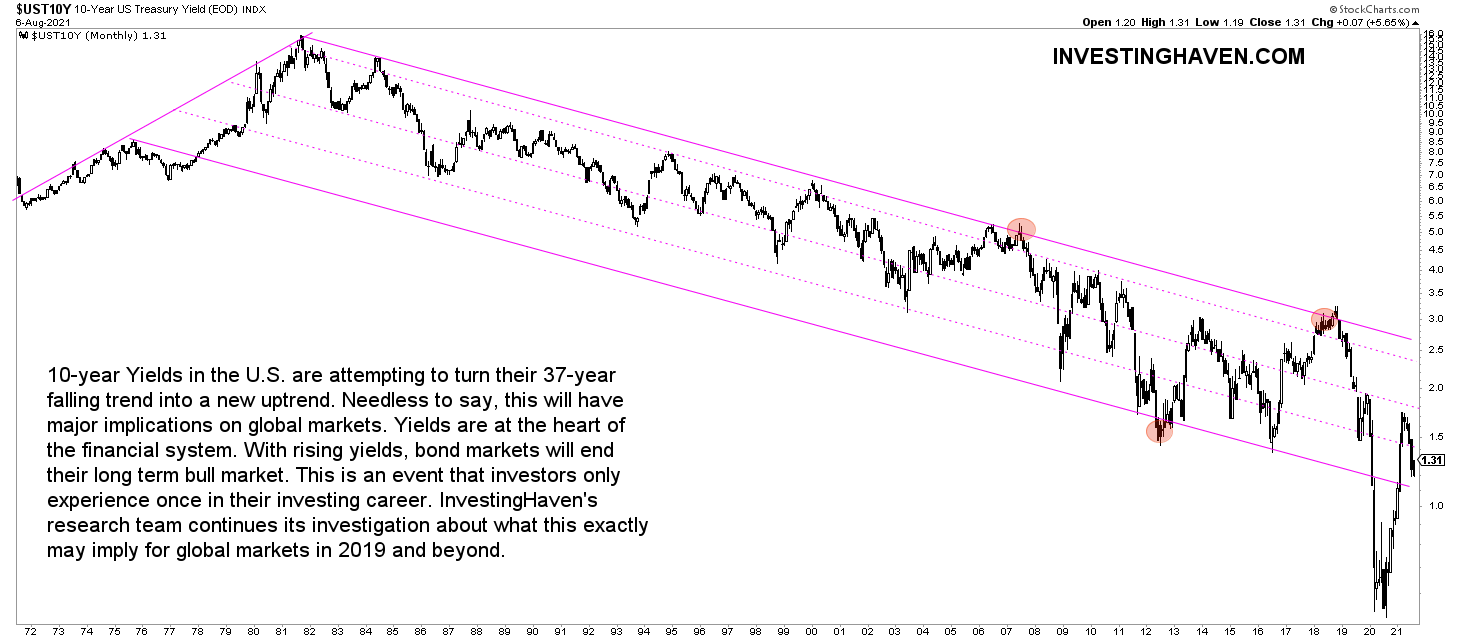
Chart update: August 8th, 2021
What we conclude from leading indicator #1 is that stocks will be bullish in 2021. This suggests a bullish Dow Jones forecast for 2021.
Leading Indicator #2 For Our Dow Jones Forecast
The leading indicator for our Dow Jones forecast is one that gives us a more granular insight.
While the first leading indicator is about the direction of risk sentiment, our second indicator looks at the timing of it! That’s why they are both complimentary.
By far THE most important timing indicator for risk is the Russell 2000 index. This makes sense because it tracks small caps, and there is no ‘risk on’ if small caps are consolidating or declining.
What we have witnesses is an 18 month period of neutral to bearish price action in the Russell 2000. This means a ‘risk off’ cycle, and it makes perfect sense in the bigger scheme of things. Every 18 to 24 months stocks go from ‘risk on’ to ‘risk off’. After the ‘risk on’ period in 2017 there was a ‘risk off’.
At the time of writing (last week of Oct 2019) we are about to clear this one and only decision point on the Russell 2000 index chart: 1625 points. We identified this a year ago.
Once the Russell 2000 index crosses 1625 points we have a confirmed ‘risk on’ cycle.
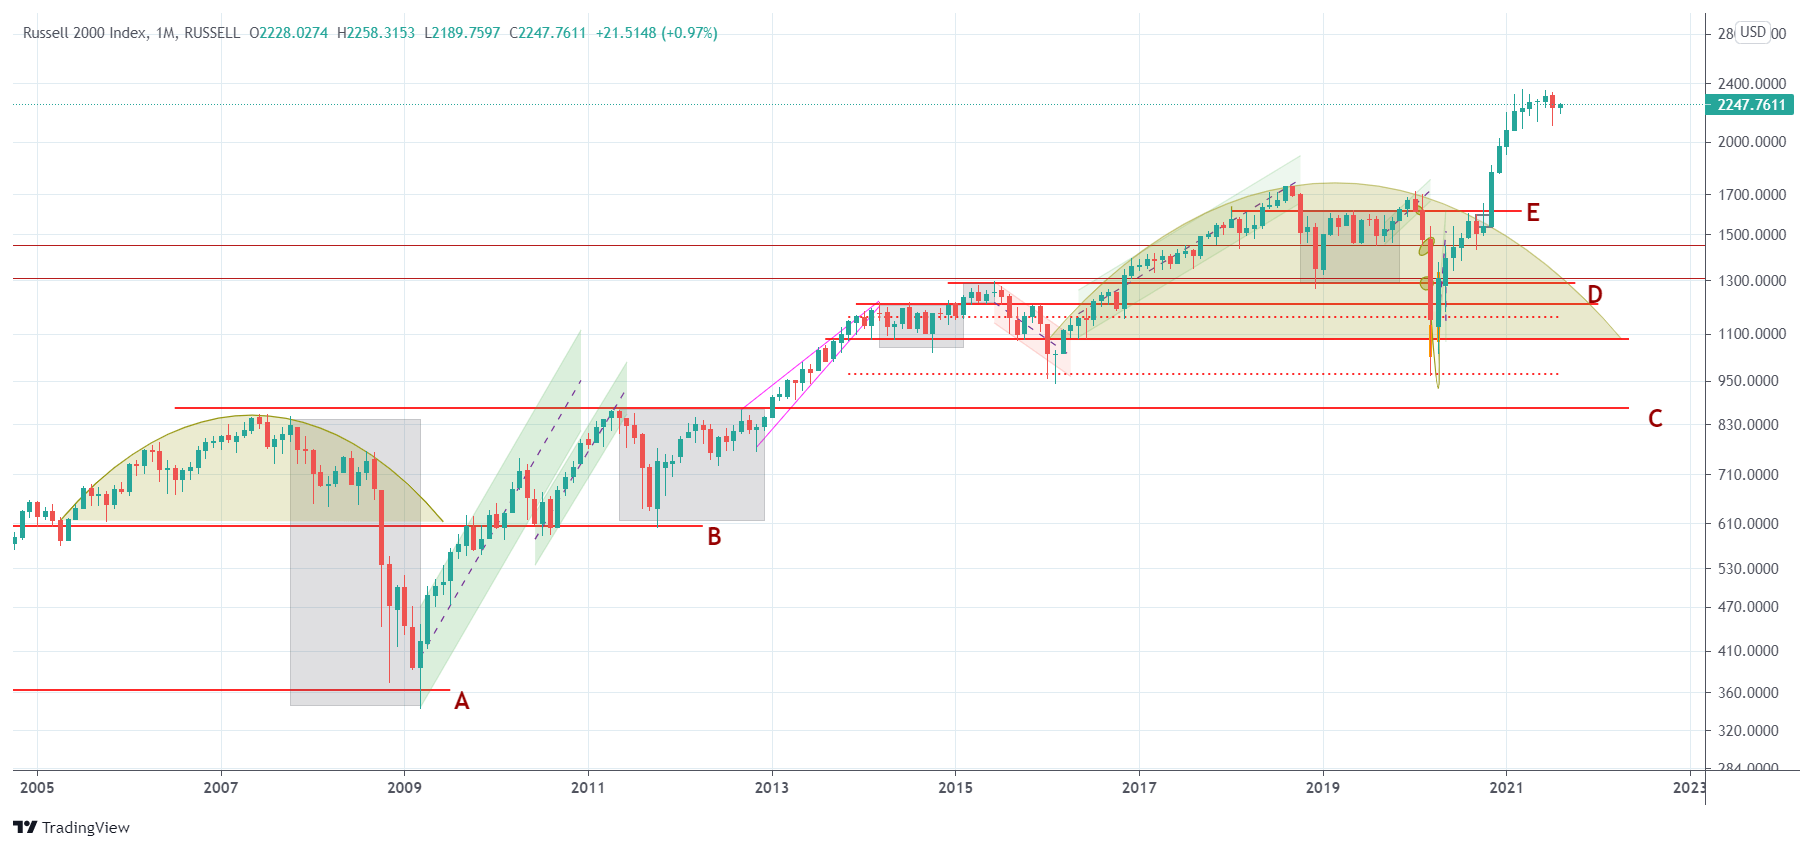
Chart update: August 8th, 2021
Wait a second. Is it that simple?
Yes it’s that simple!
No need for detailed calculations, a bunch of technical indicators (that anyone with an IQ of less than 220 can understand), no death crosses, and no other related b*****t.
Just to illustrate this point we look at the value of the death cross and the financial press. We pick out 2 articles from the Corona crash month.
The Dow is on pace for its worst month since the Great Depression, but here’s why all hope isn’t lost amid the coronavirus crisis on Marketwatch (March 23d, 2020)
Exactly at the lows of the Dow Jones this article made you think the worst was to come because of a death cross:
Besides obliterating the bullish trend the plunge has done a lot of technical damage, with a bearish, so-called death cross forming in the Dow, where the 50-day moving average — which many chart watchers use as a short-term trend tracker — crosses below the 200-day MA, which is widely viewed as a dividing line between longer-term uptrends and downtrends.
Buckle Up Your Money Belts: The Ride Won’t Get Smoother Soon on Barron’s (March 20th, 2020)
Exactly at the lows of the stock market this article suggested much more downside in stock markets!
Investors don’t need any of this, no technical indicators nor death crosses nor financial news which is lagging. Investors need leading indicators so they can do a decent forecast which they can adjust as the market releases new data every day / week / month.
In order to understand long term trends (which is meant for investors, not for short term traders) you need to simplify things and set a few rules to determine trends.
What we conclude from leading indicator #2 is that stocks will be bullish starting in 2020. This suggests a bullish Dow Jones forecast for 2021.
Dow Jones Chart Analysis: Top Down Approach
As a next step we look at the Dow Jones charts in a top down approach.
We stick to our method to look at any market from the monthly chart, then to the weekly and then the daily. If possible however we start with the quarterly (followed by monthly and weekly).
The Dow Jones has a very long history so we can look at the longest timeframes.
What we try to accomplish is very simple: get confirmations of one and the same trend (or trend change) on multiple timeframes. The more timeframes confirm a direction or trend change the higher the reliability!
Dow Jones Quarterly Chart
The longest timeframe is the quarterly chart on 100 years. Note that we updated our article The Dow Jones Historical Chart On 100 Years with this up-to-date chart and related insights.
This chart provides a breath taking picture with essentially one huge rising channel. The one and only exception was the Wall Street crash of 1929. The decline back then was devastating, and it resulted in the Dow Jones falling to levels so low that even on a 100 year chart it was exceptional.
Note as well that each and every time the top of this giant channel is tested (1928, 2000, 2007 one band below the top) it results in a long and/or exceptionally aggressive decline.
Right now we see the Dow Jones in the upper band of this channel. Given the insights from our leading indicators we expect a ‘risk on’ cycle to materialize in 2021. This will bring the Dow Jones to the top of the channel. Watch out after this as the Dow Jones at 100 year resistance might be pretty ‘shaky’.
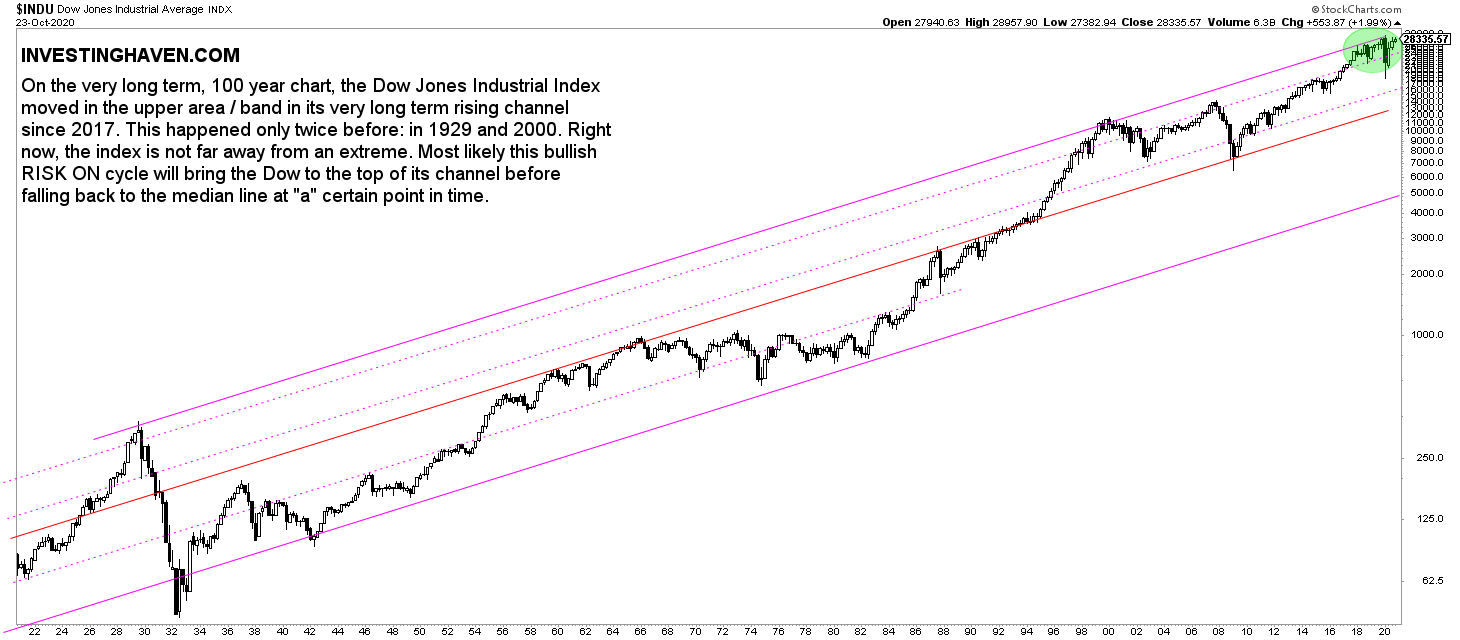
Chart update: October 25th, 20′
For now the quarterly chart suggests there is some upside potential.
Dow Jones Monthly Chart
If we zoom in we get the monthly chart on 20 years. Note that we updated our article Dow Jones Long Term Chart on 20 Years with this up-to-date chart and related insights.
The ‘risk off’ cycles are nicely represented on this chart. They coincide with the ones on the Russell 2000 chart above. After the 2018/2019 ‘risk off’ we will now see a strong rise, is what this chart suggests.
It also provides more depth into the green circle on the 100 year chart!
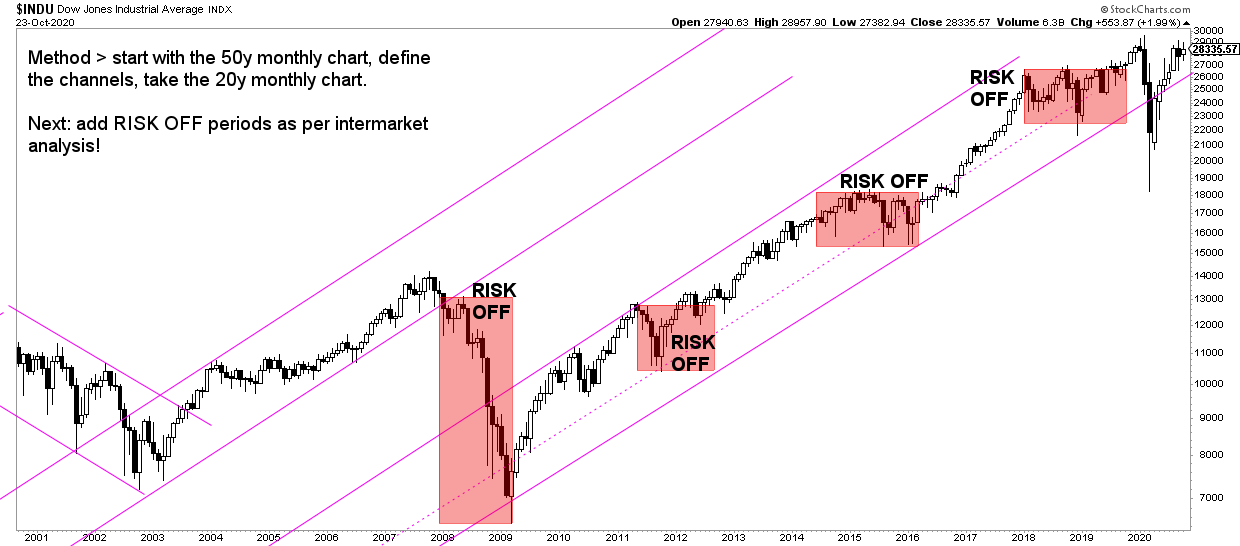
Chart update: October 25th, 20′
The monthly chart confirms the quarterly. This is great, and we only get continuous evidence of a bull market in stocks. The Dow Jones forecast for 2021 is bullish.
Dow Jones Weekly Chart
The weekly adds just one more detail: the recent consolidation combined with the Dow Jones becoming pressure cooker we now see which is ready to start moving higher!
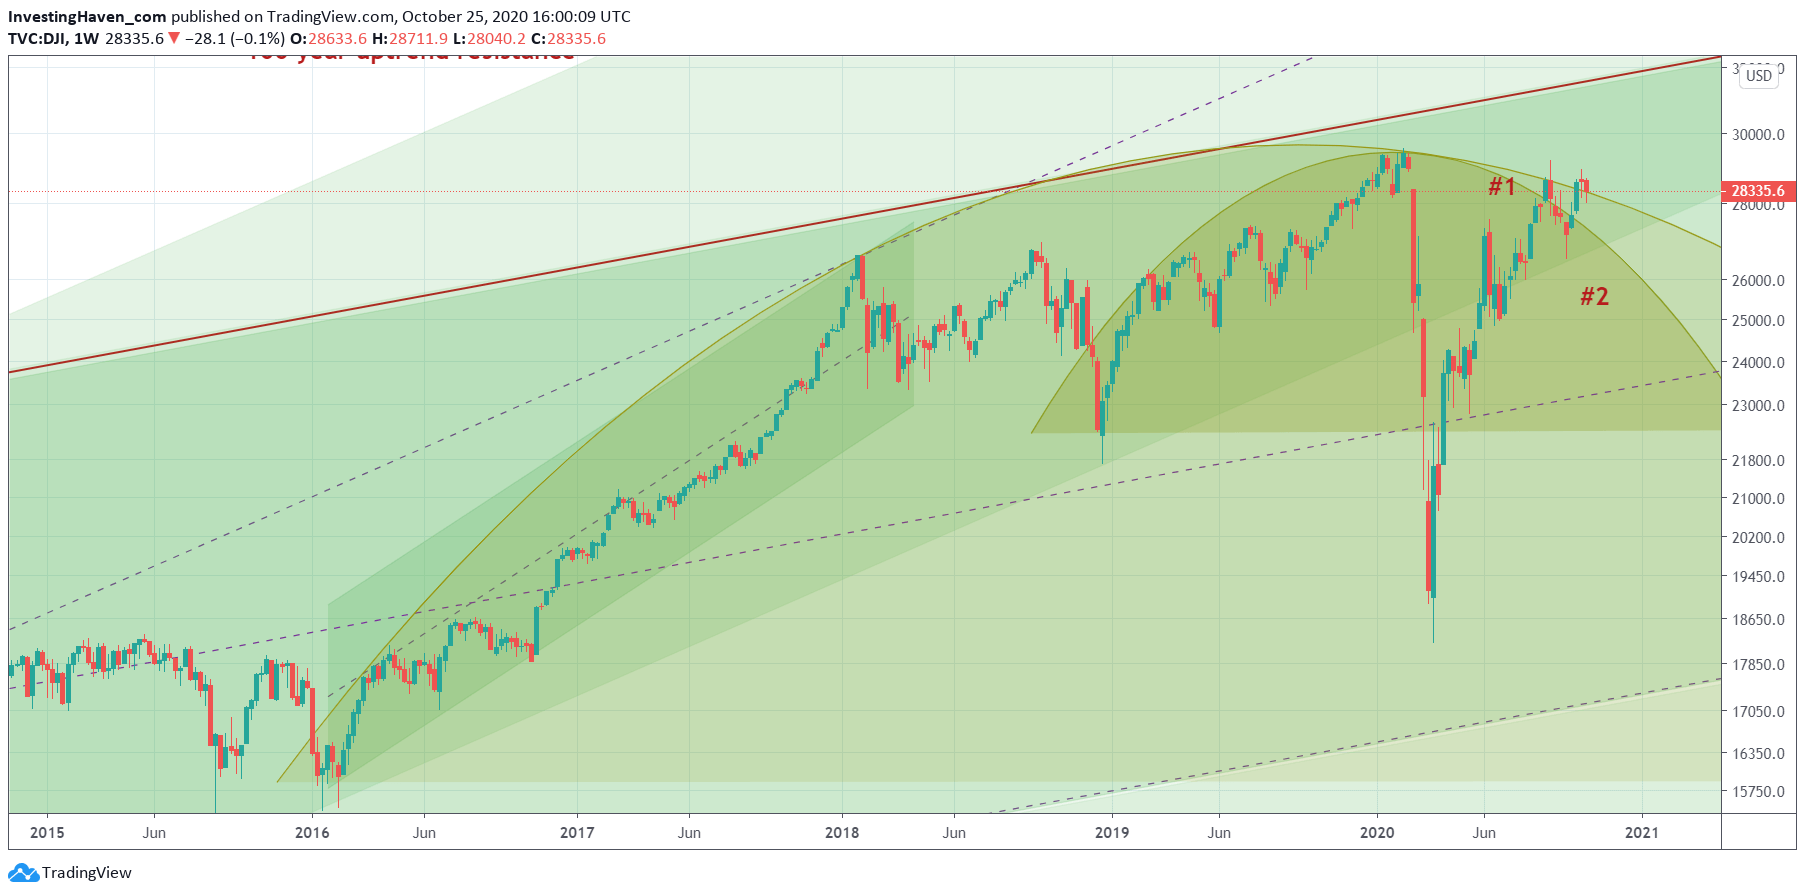
Chart update: October 25th, 20′
All timeframes support the same conclusion: the Dow Jones bullish forecast for 2021 has a high reliability. With a high level of confidence we can say that stocks, especially the Dow Jones index, will rally higher in 2021!
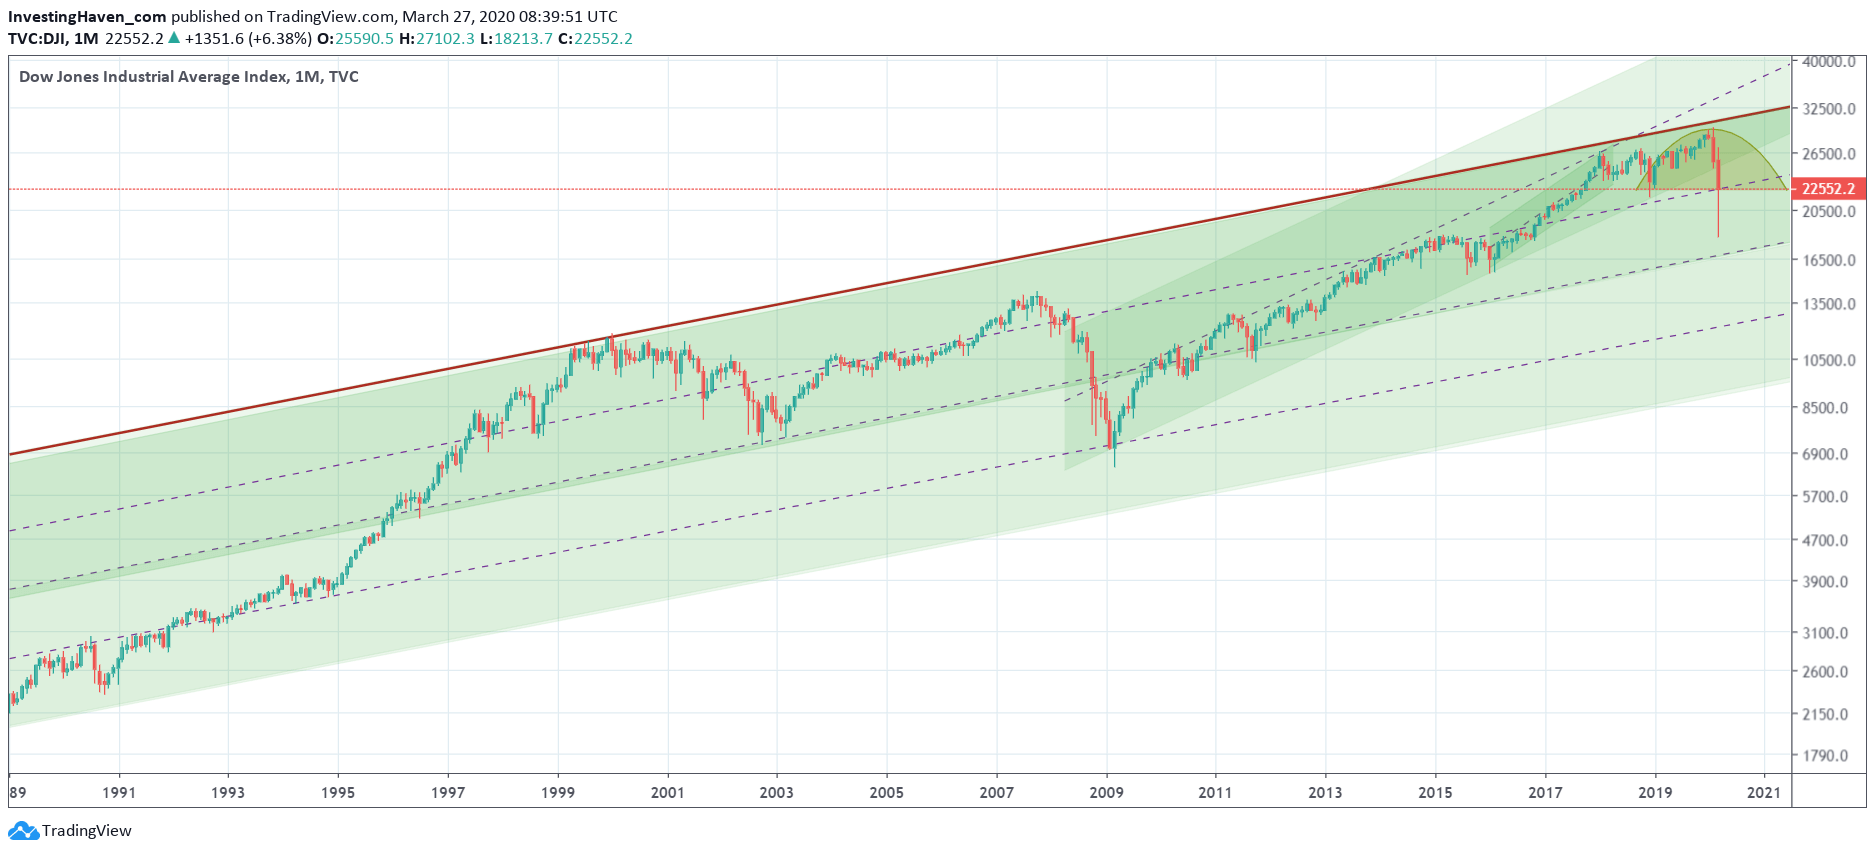
Corona Crash Update on 03.27.20
This paragraph and below charts contain an up-to-date version of the Dow Jones long term chart on 20 years. We wrote this update on March 20th, 20′, at the depth of the Corona crash.
First the 13 year chart.
Clearly the Corona crash was unique in that it was a faster decline than the 2008 crash in terms of speed. The Dow Jones long term chart has 4 sub channels as part of its 100 year rising channel (light green with the red resistance trendline at the top).
Near the end of March of 20′ it looks like the Dow Jones created a huge ‘wick’. It fell from the highest channel to the lower channel, but stopped falling near 2016 support. It came back up *exactly* at the support of the highest channel.
The monthly closes will be crucial: if the monthly closes of March and April 2020 are still in the highest sub channel we consider this a continuation of the bull market.
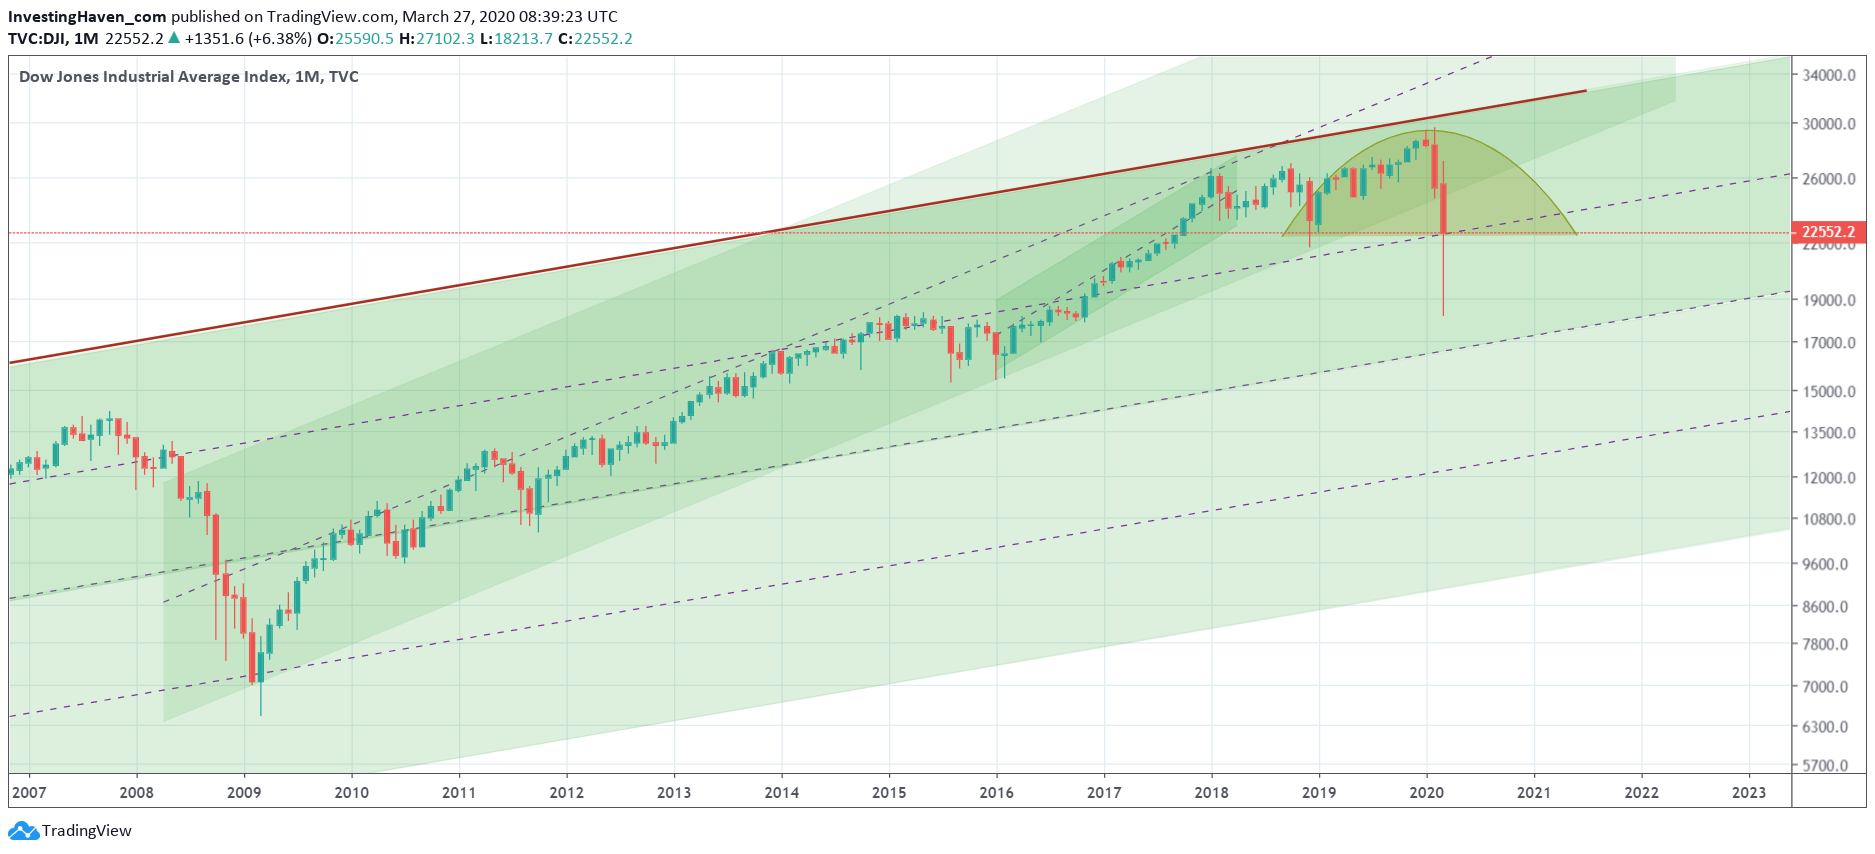
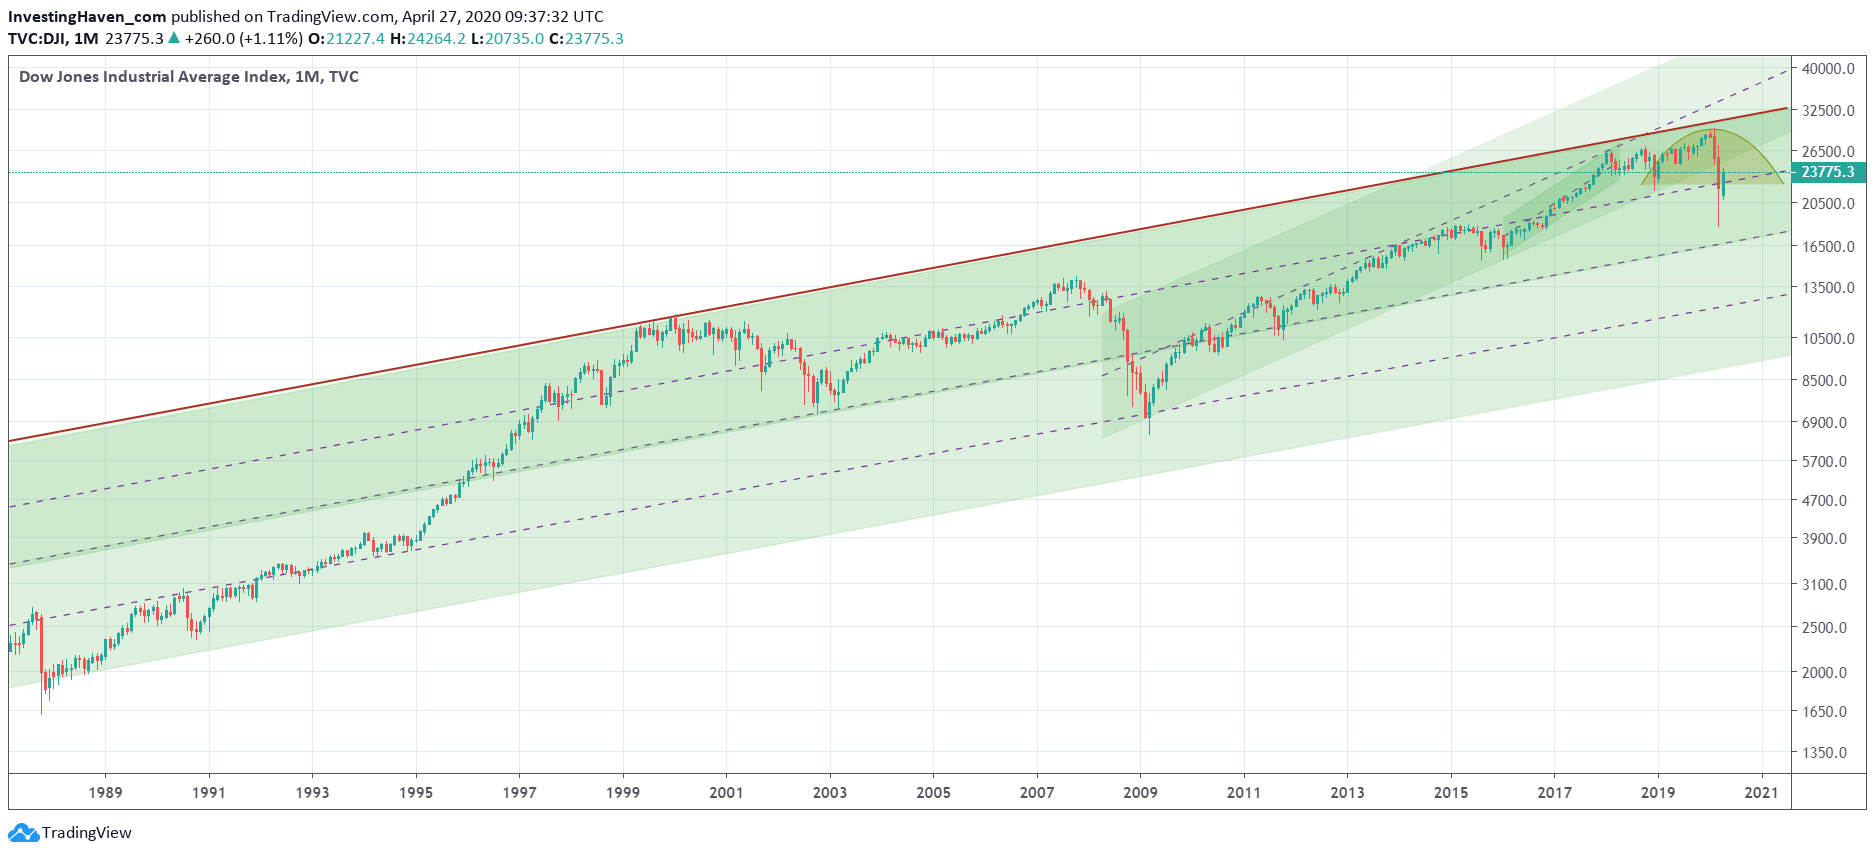
The 30 year chart puts the findings of the above chart into perspective.
The decline was epic, but the recovery in the week of March 20th, 20′ was equally epic.
We see this ‘wick’ (monthly candle, how far it dropped and to which point it recovered) in a bigger picture on below chart.
Visibly, there was a bearish reversal in 2019 and with the Corona crash lows. Arguably the Dow Jones will go back up to test the resistance of this yellow half rounded formation. The million dollar question is whether it will break above it or whether it will confirm a new bull market once it is back at that level (which we estimate to be 26,000 points).
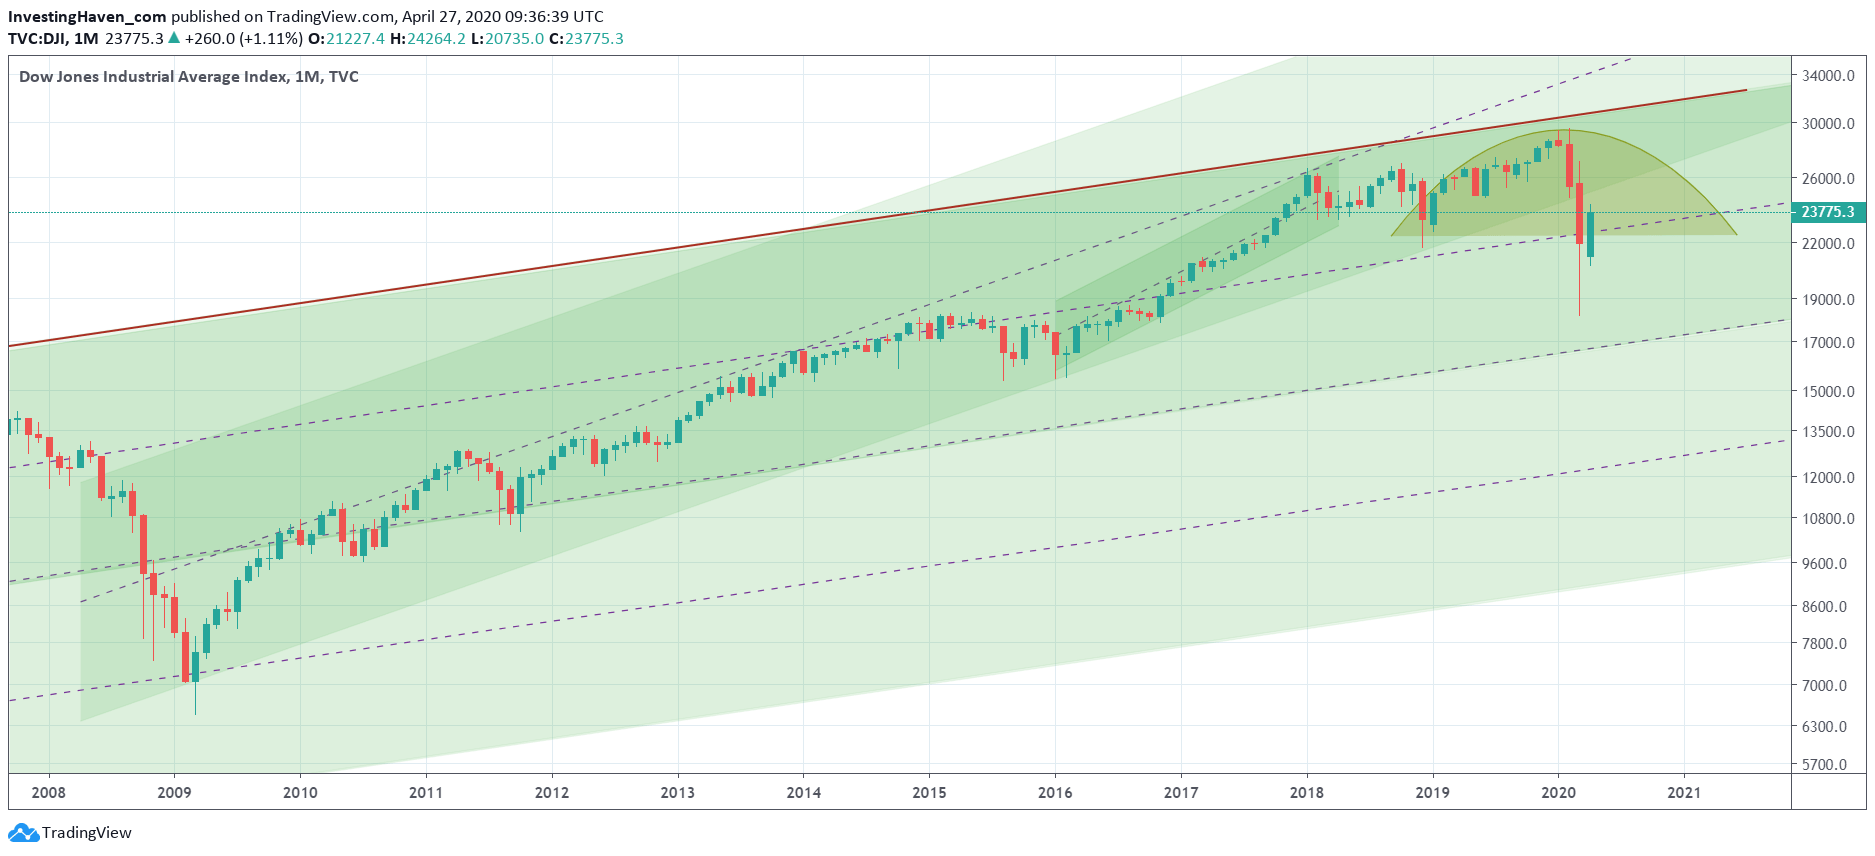
Corona Crash Update on 04.27.20
This paragraph and below charts contain an up-to-date version of the (very) long term Dow Jones price charts as well as the 20 year Dow Jones chart. We wrote this update on April 27th, 20′, one month after the depth of the Corona crash.
This is the 12 year Dow Jones chart, and it has a very clear message.
First, the Dow Jones index sold off heavily. However, it only moved for a few weeks into the lower channel.
Second, this long wick which is visible on this chart is now back up into the highest of the 4 long term channels.
What this really means is that the 2009 bull market may be broken (dark green rising channel on below chart), but the overall uptrend of the Dow Jones is still intact.
In other words no matter how brutal this Corona crash was it did violate the 2009 bull market, but it did not impact the longer term uptrend. Our initial Dow Jones forecast, even after the Corona crash, remains valid. It may not be achieved exactly within 2020, but maybe a few months into 2021.
This means that our Dow Jones forecast is still on track, it may be slowing down by the Corona crash. But our forecast did not invalidate, on the contrary.
When will our Dow Jones forecast invalidate? Once this index falls again below 22,000 points! Not likely to happen though.
The conclusion from the above chart is also visible on the next chart.
Dow Jones Charts Update: August 2021
The Dow Jones charts shown above are from a very uncertain period right after the Corona crash. Fast forward, more than a year later, we can find some pretty unusual and phenomenal setups in the Dow Jones.
100 years Dow Jones chart
On the +100 year timeframes we can find that every time the Dow Jones touched the resistance line of this giant trend channel it came down. In fact, it started a real crash every time.
Not only do we see in 2021 that a market crash did not happen but we also see a successful breakout.
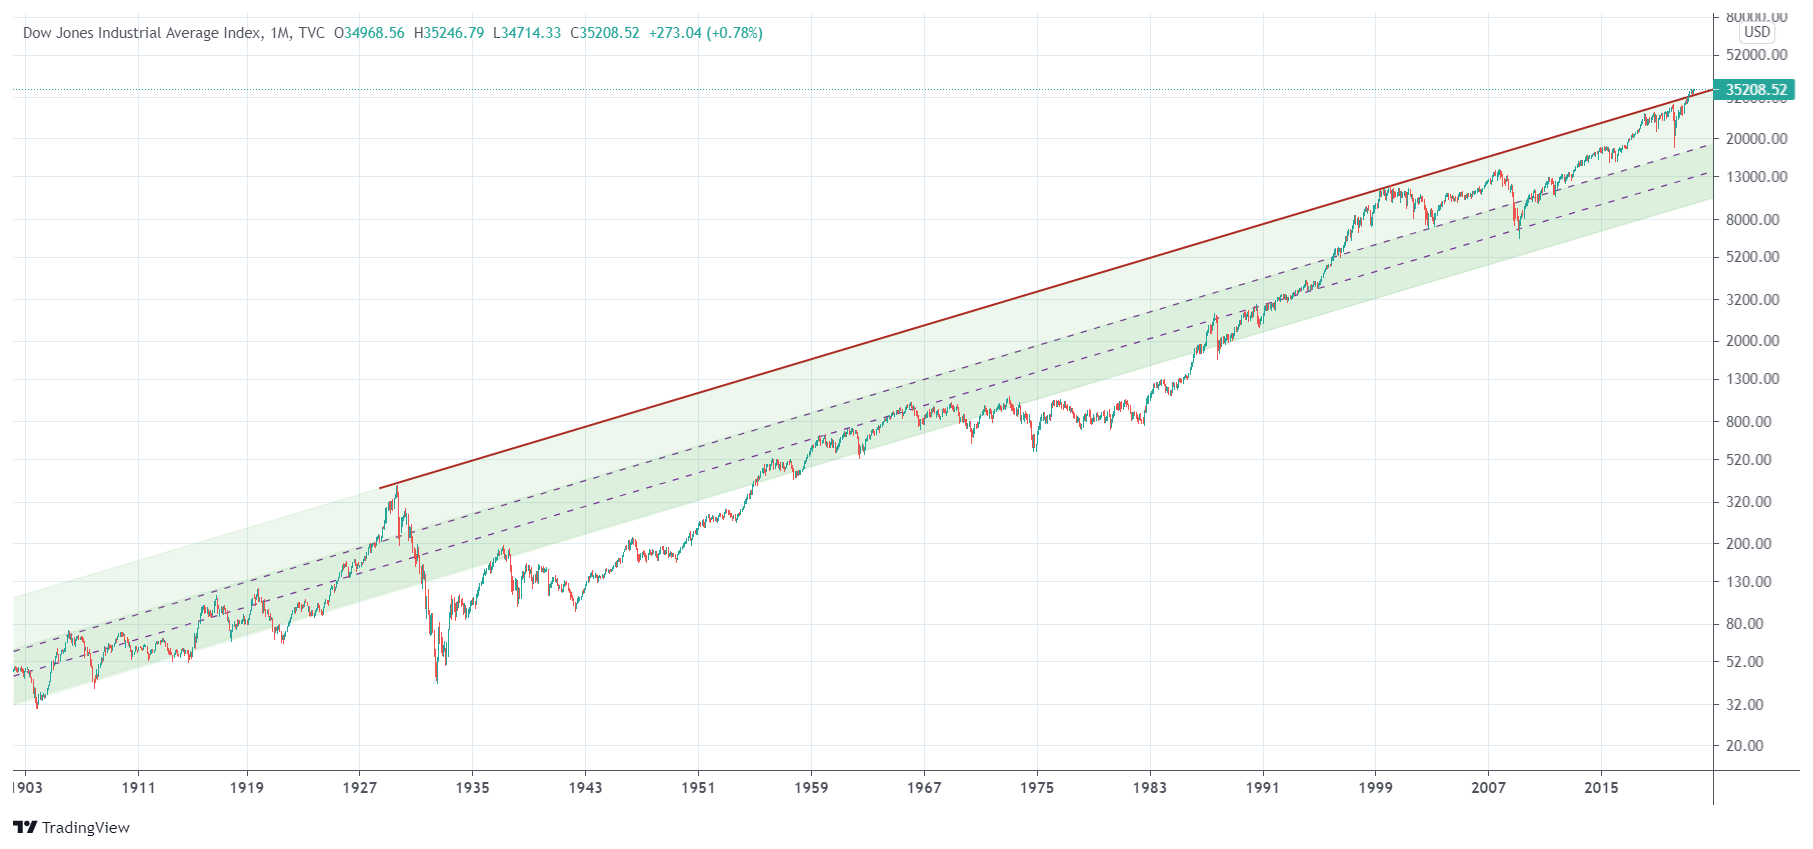
If we zoom in on the above chart we can see on the 20 years Dow Jones chart below how the breakout his happening. At this point in time it looks like there is sufficient evidence to believe that the breakout is for real.
The daily chart even shows that the chart pattern is morphing into a bullish reversal above the 100 year trendline which is absolutely phenomenal and unbelievable.
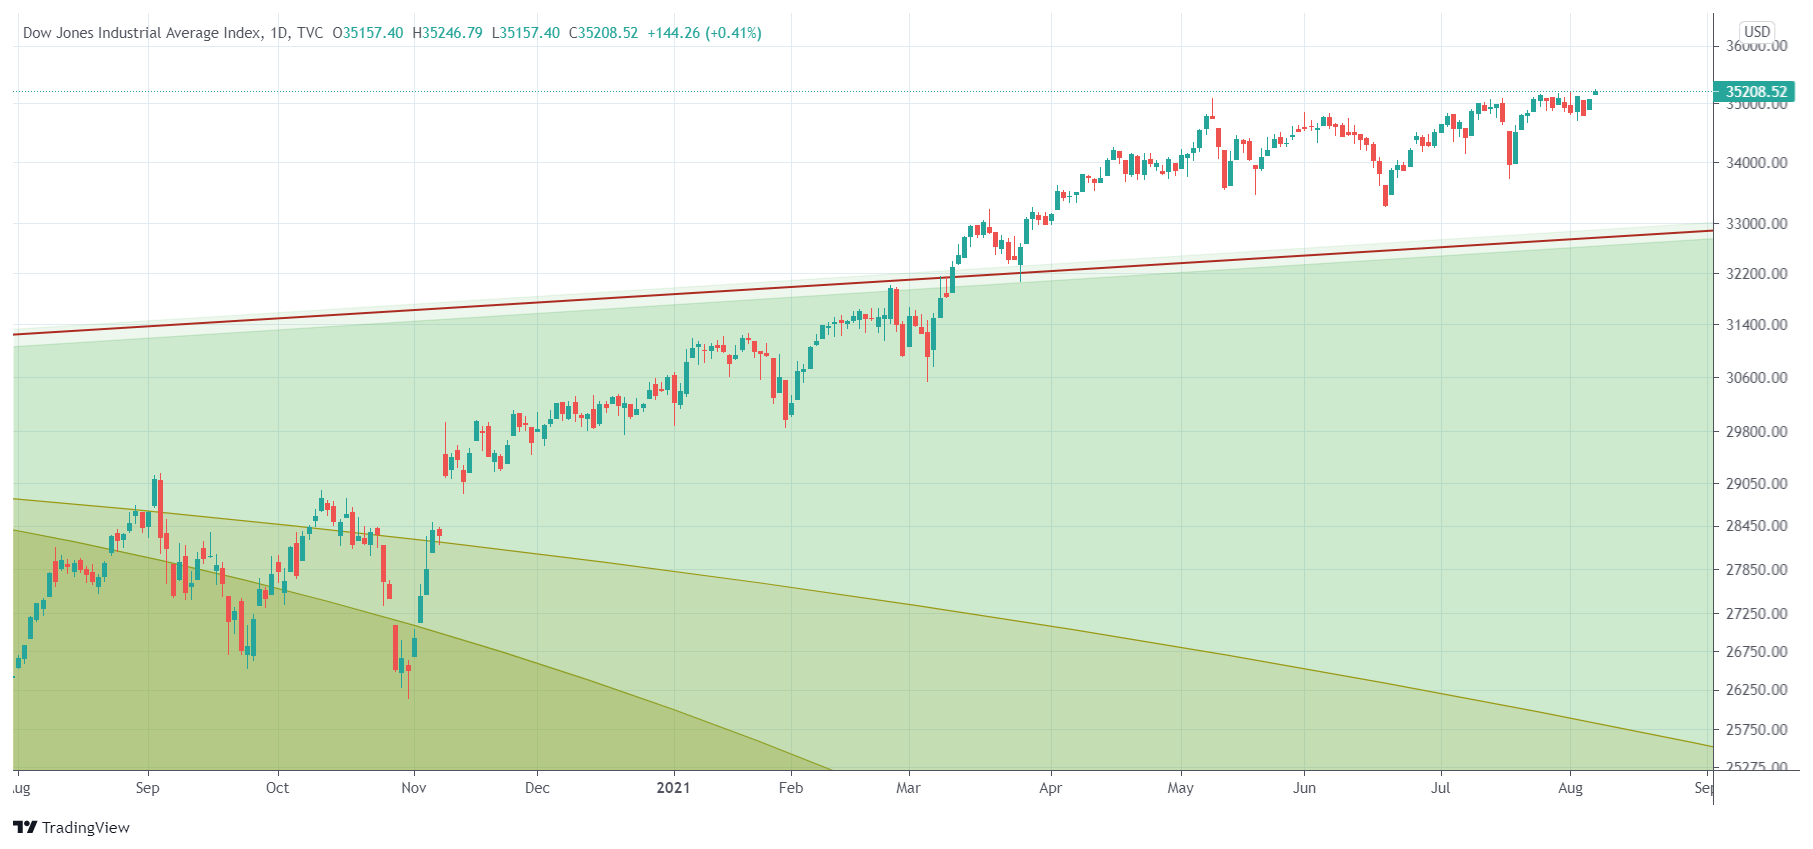
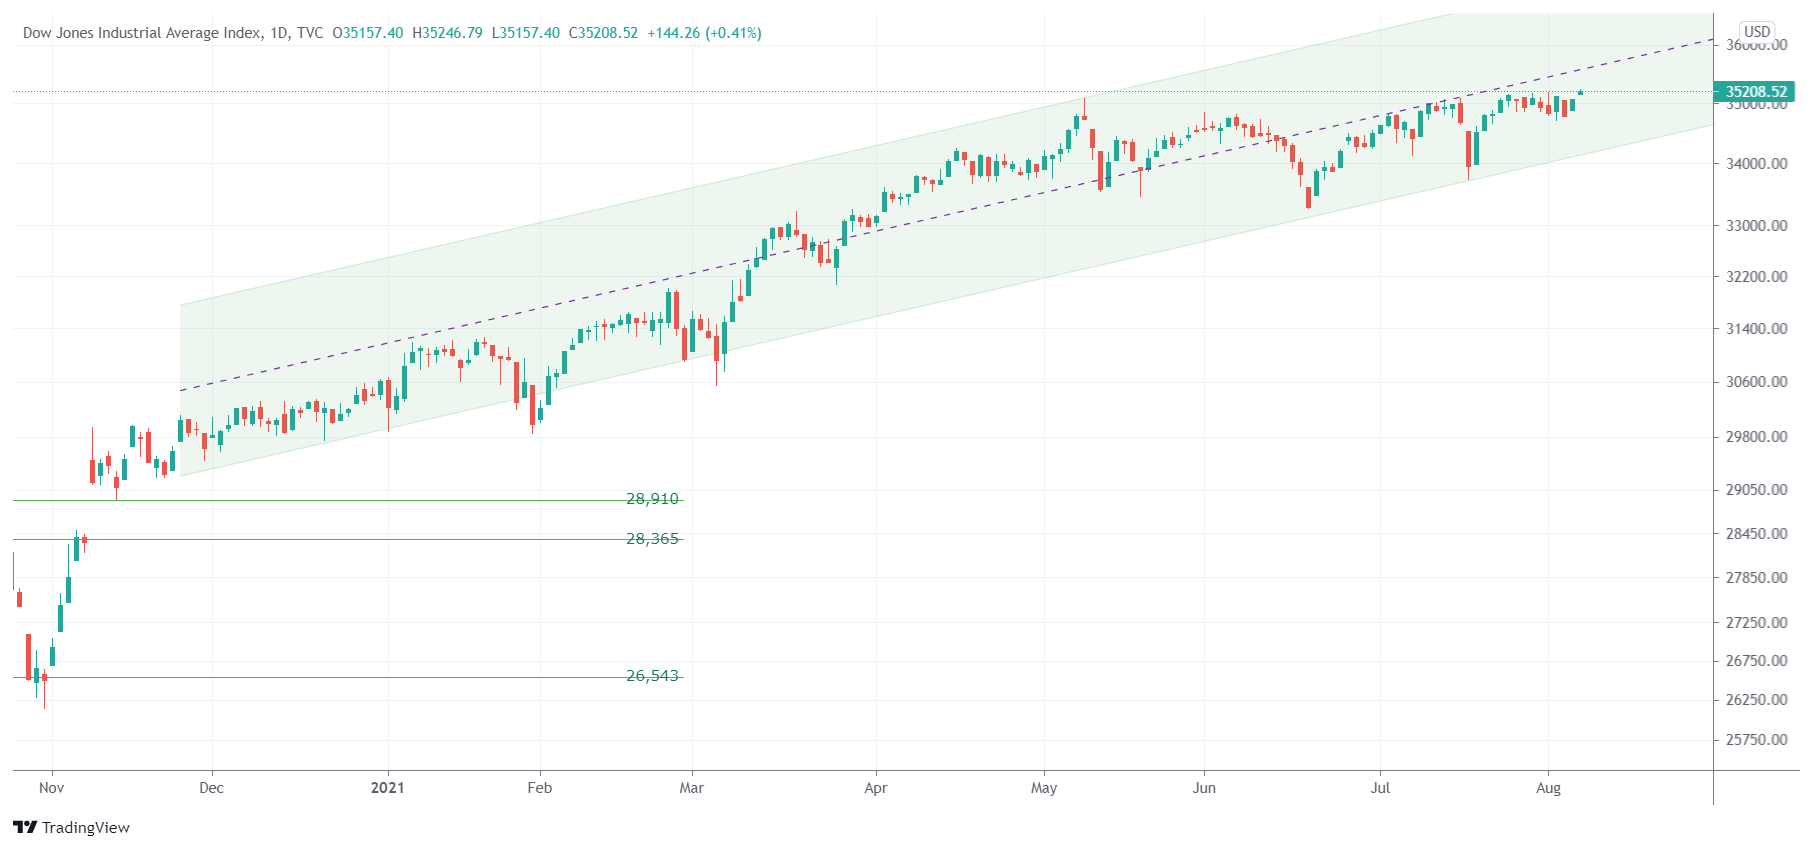
This is a different view of the same 1 year Dow Jones chart. Just looking at this one chart would not make you think that there is anything special, but considering the context of the 20 year and 100 year charts shown above it is clear that the daily Dow Jones chart is absolutely phenomenal.
Results of our Previous Dow Jones Forecasts
Readers should consider that we did more generic stock market forecasts in previous years. So we consider in this table our stock market forecasts more than just specifically Dow Jones forecasts.
This is an overview of our Dow Jones forecasts from previous years. We publish these forecasts typically before the forecasted year starts.| Year | Our Dow Jones forecast | Highs | Lows | Accuracy of our outlook |
|---|---|---|---|---|
| 2017 | Very bullish | 24,850 | 19,701 | Spot-on |
| 2018 | Neutral to bearish | 26,840 | 21,787 | Accurate but we did not expect this heavy sell-off in Q4/2018 |
| 2019 | Neutral to bullish | 27,388 | 22,698 | Accurate but we expected the 'risk off' to end early 2019 |
| 2020 | Bullish | 30,502 | 23,553 | Accurate but we did not predict the Corona crash lows |
| 2021 | Bullish | 36,446 | 29,552 | Very accurate with our forecast of 32,000 points |
Dow Jones Forecasts by Other Analysts
There are hardly any Dow Jones forecasts out there.
All financial media does it talk about day-to-day economic and political events, and relate the Dow Jones price change in the same article as if those are correlated. Nothing is further from the truth, and it shows how challenging it is to do a longer term forecast in the public domain. One of those few expectations is published on Marketwatch, another one here on BI.
Yes we have to guts to publish forecasts, and be ‘vulnerable’ and subject to criticism in case we prove to be ‘wrong’.
This is an overview of forecasted platinum prices for 2020 by other analysts. We don't support these forecasts, we just share them to illustrate how other analysts think about a platinum price forecast for 2020 and beyond.| Year | Analyst | Dow Jones prediction |
|---|---|---|
| Dow Jones forecast 2020 | InvestingHaven's research tam | 32,000 (2020 peak) |
| Dow Jones forecast 2020 | Ed Yardeni from Yardeni Research | 31,500 |
| Dow Jones forecast 2020 | Goldman Sachs | 10 pct rise |
| Dow Jones forecast 2020 | (no other forecast published) | (no other forecast published) |
Continuous Follow Up on our Dow Jones Forecast (free forecasting email newsletter)
We absolutely recommend to subscribe to our free newsletter in order to receive future updates. We publish updates on our Dow Jones forecast. But we also do publish other forecasts.
We continuously, throughout the year, publish updates on our annual forecasts. Any revision in our forecast are published in the public domain and appear in our free newsletter. Therefore, the only way to track the pulse of markets and stay tuned with our forecasts is to subscribe to our free newsletter >>
Must-Read 2021 Predictions from InvestingHaven’s Research Team
We absolutely recommend to read the following predictions as they are highly informative and very well researched.
Enjoying our work? We invest in broad stocks in our Momentum Investing portfolio. We play metals, silver, tech stocks, and other trending segments. Our Trade Alerts premium service plays the S&P 500 in the short to medium term, and an auto-trading service (fully automated trading SPXL/S) is ready to be launched right after summer of 2021.


