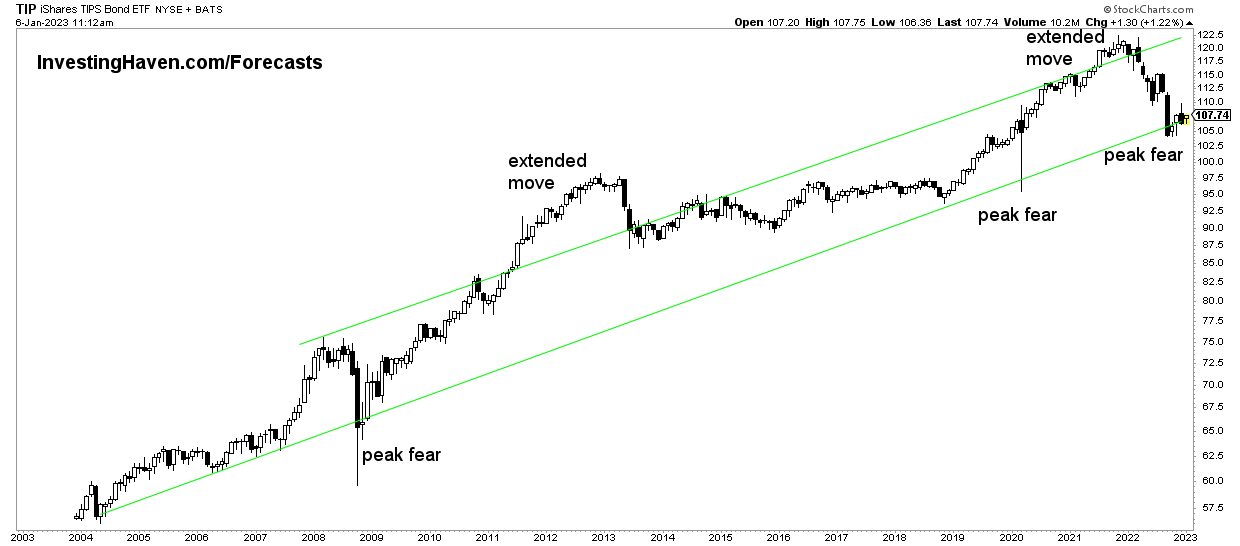
Throughout most of our 2023 forecasts we tipped TIP ETF as the single most important chart. We said so and will re-iterate: the long term pattern on the long term chart of TIP ETF will be key for markets in 2023. It will directly and significantly impact our silver forecast, gold forecast, our Dow Jones outlook, green battery metals like lithium and graphite, in sum all of our 23 forecasts.
The single most important chart is the one embedded in this article. It is TIP ETF, the weekly chart, on 20 years (since inception).
TIP ETF is a proxy for inflation expectations. As seen, inflation expectations crashed throughout 2022. This happened on rising inflation. Odd? Not really, inflation expectations is a looking forward instrument. In 2022, the market was focused on the disinflationary monetary policy of policy makers.
What inflation expectations could, should, might be doing right now is ‘sniffing’ for the end of the Fed’s tightening cycle.
The chart suggests that the market believes that monetary tightening is coming to an end, slowly but surely though. That’s how we read the chart.
If the long term pattern of TIP ETF is going to hold, it will resolve higher. This will be the driver (leading indicator) for markets and metals to resolve higher in 2023, presumably in the next few months already.
Investors keep a close eye on this chart as opposed to freaking out by fear mongering media headlines and tweets. The consensus view is bearish. This means that fear can easily be created by comparing 2022 with 2008. Remember, this is an act based on fear, not data. The data suggest that 2022 is not like 2008, we explained this extensively and in great detail in our Momentum Investing research note to members: Must-See Charts: 7 Timing Conclusions and 2008 Comparisons.


