January 2025 will be the ultimate test for the gold market: if gold continues to trade in a narrow range, it would be the ultimate confirmation of gold’s secular bull market. So far, the gold price remains steady.
READ – Gold prediction 2025 & beyond
While it’s interesting to read the daily gold headlines, they aren’t really helpful in understanding the trend:
Gold prices dip as yields rise, market girds for US economic data (Jan 6th)
Gold pares gains as dollar rebounds following US jobs data (Jan 7th)
Gold climbs after weaker-than-expected private payrolls data (Jan 8th)
Let’s look at the message of the chart(s) to understand the trend(s).
USD strength – gold price steady
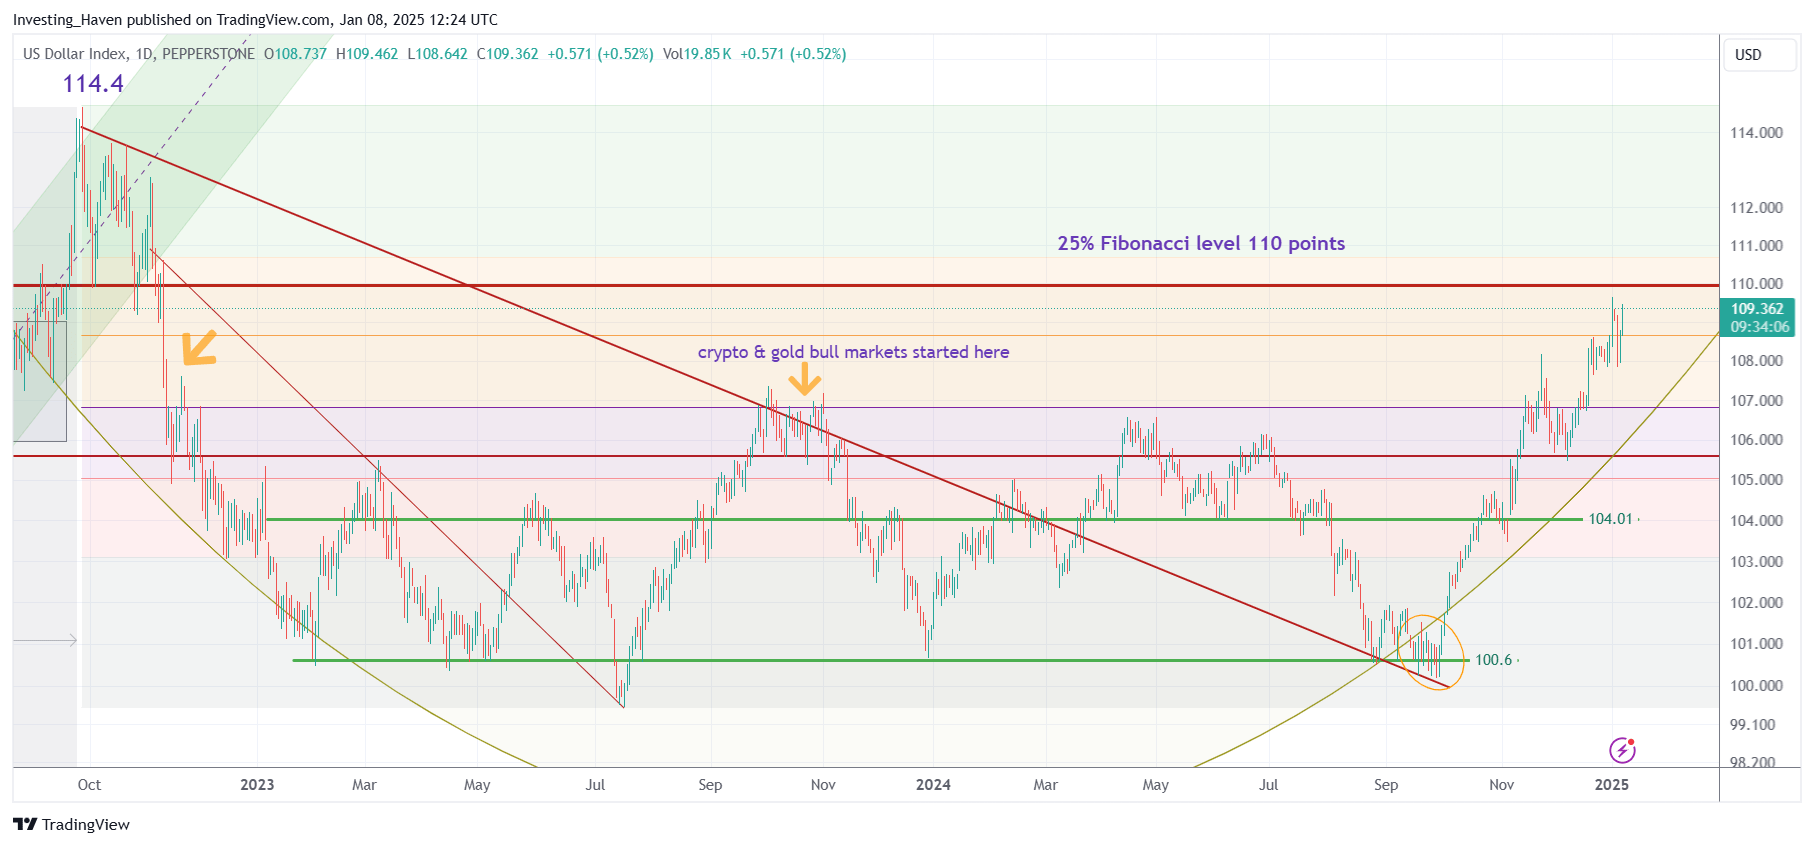
By far, the most important intermarket play for gold is the USD (followed by Yields, see next section).
As seen below, the USD is super strong, with a rise of 9,300 points in a matter of 2 months.
Amazing!
Gold, in this environment, is holding up surprisingly well.
We do expect the USD to find resistance either at its 25% Fib level which is 110 points or, ultimately, closer to 114 points. The USD should be close to resistance. If the USD continues beyond 114 points, which seems unlikely, all markets & metals will face significant challenges.

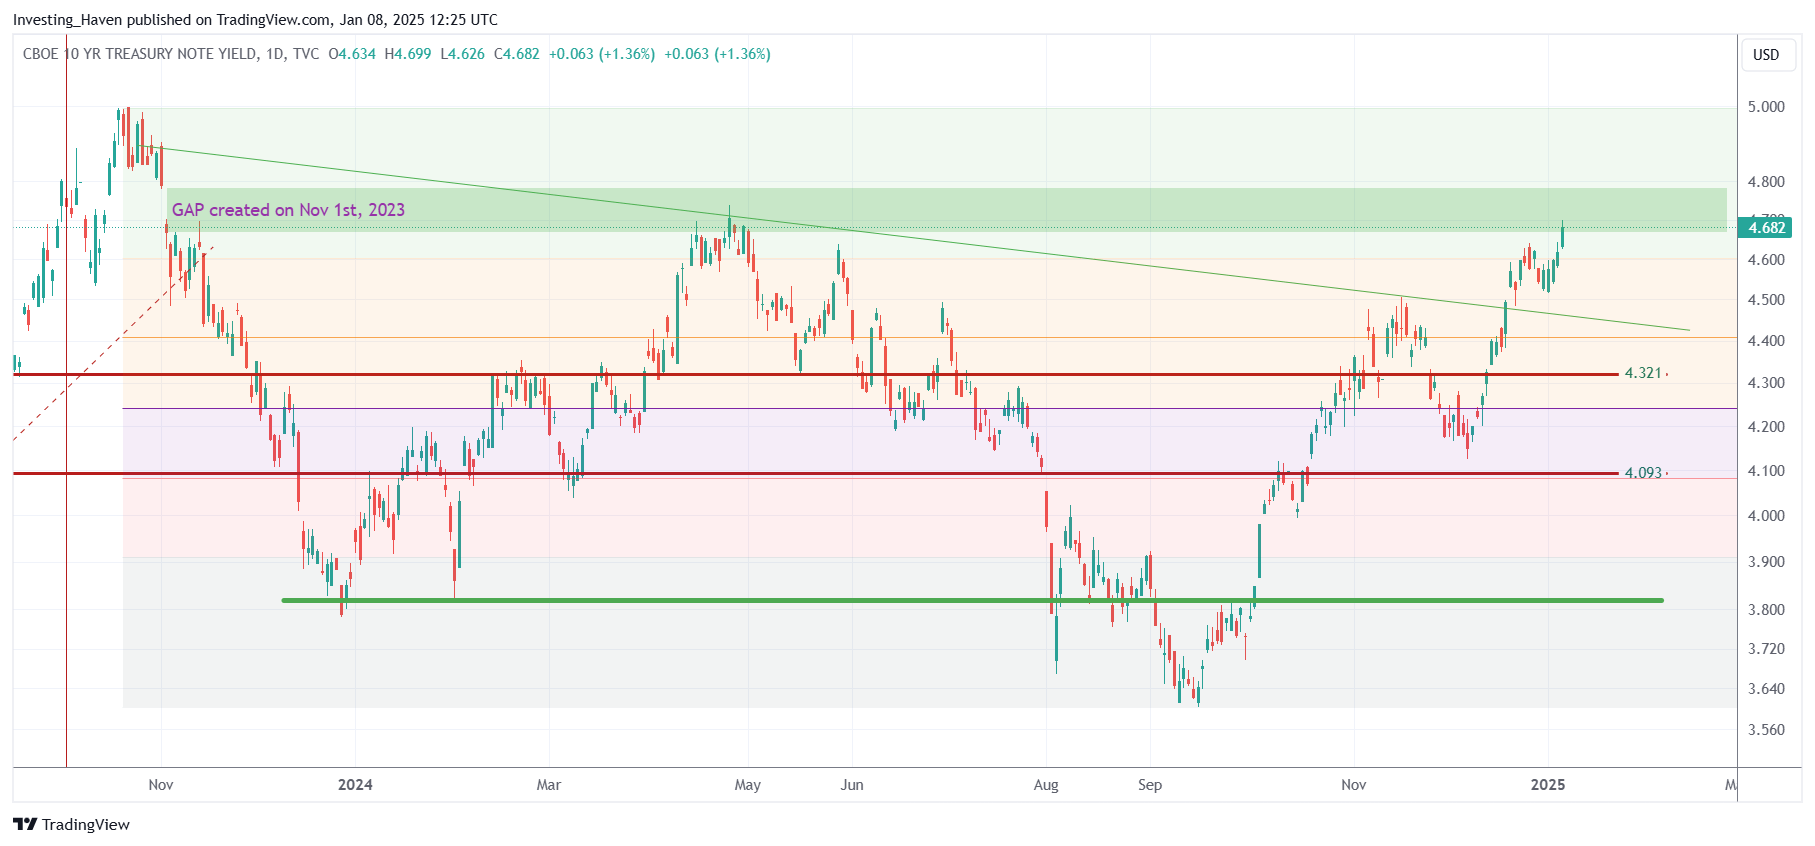
Yields strength – gold price steady
Similarly, Yields went up a lot: from 3.6% to 4.6% in 3 months.
Same story – the gold price steady given this phenomenal rise in Yields.

What is causing the USD and Yields to rise so much?
Most likely, it’s the expectations of more inflation because of government policies per Trump 2.0.
So, the real question is what the real rate is because that’s what gold is so sensitive for. Given the steady gold price, shown below, the answer is that the market believes that the real rate remains somehow steady despite the tremendous rise in the USD + Yields.
Gold price relative strength on the gold chart
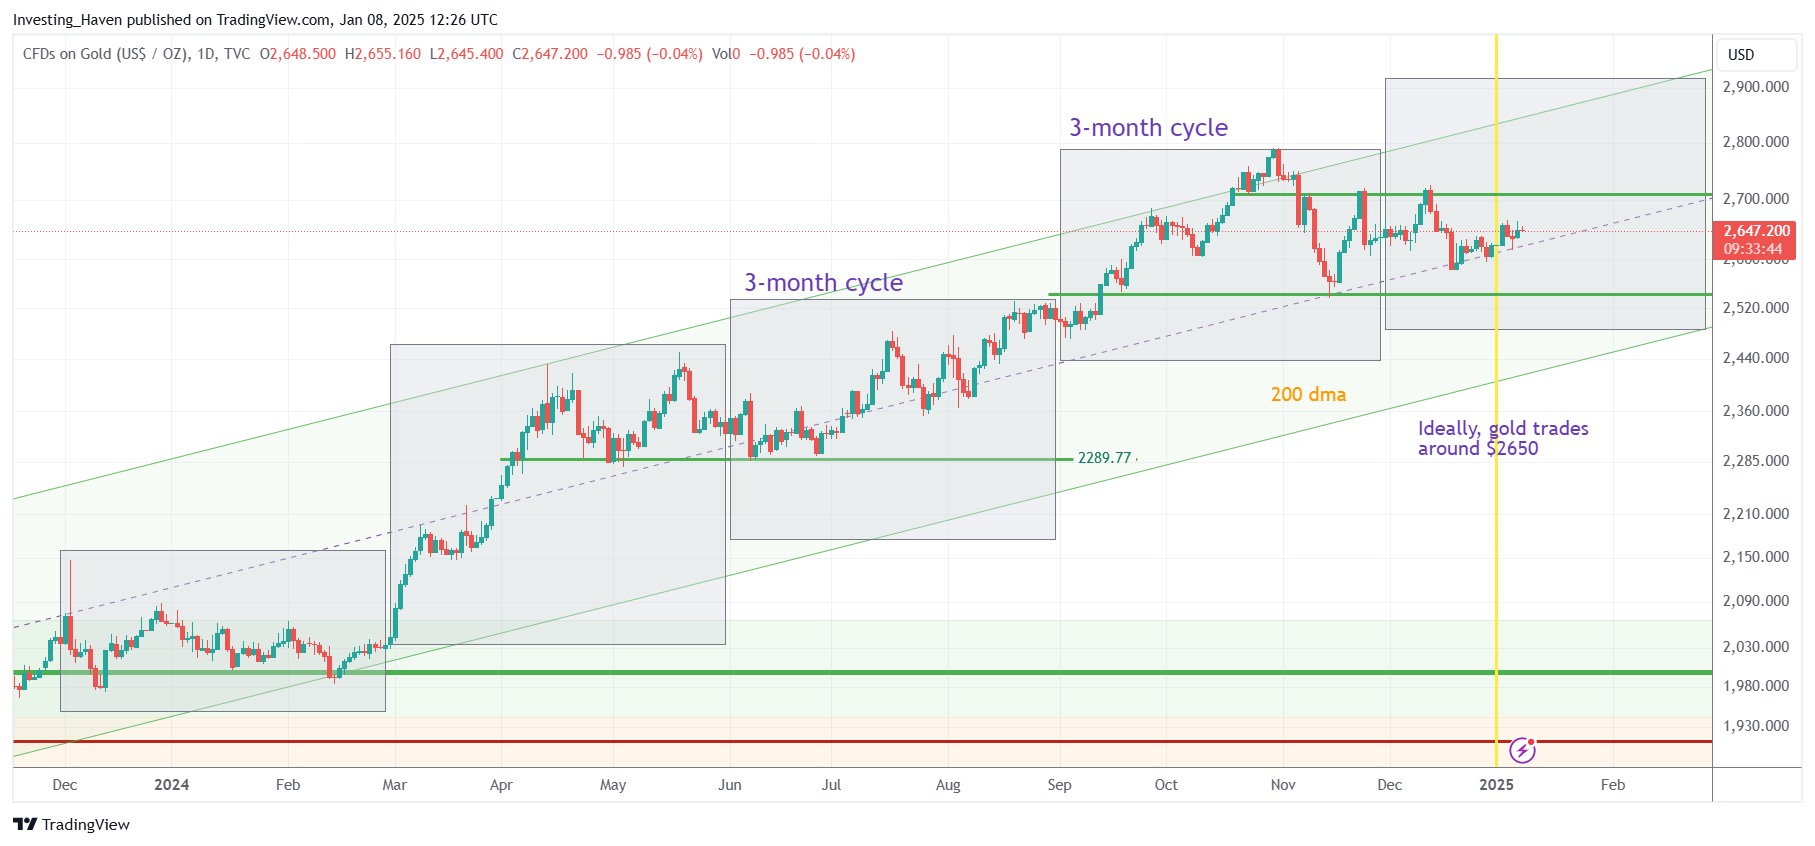
That’s a pretty interesting and fascinating gold price chart considering USD + Yields strength.
The gold chart has a few insights that are worth considering:
- Time – January 2025 will mark the mid point of the current 3-month cycle. So far, this has not been a negative cycle. It looks like this statement will hold.
- Price – we wanted gold to trade above $2650 of Jan 1st, 2025. It did. The reason? See Gold – Here Is When The Long Term Bull Market Will Be Confirmed.
- Gold is respecting its rising channel, especially the median line.
Considering the environment, gold is holding up very, very well.

Even in case gold would drop, it has a lot room to the downside before getting concerning.
Essentially, gold should stay within its channel AND should trade above $2,650 on March 31st, 2025, for a great long term outcome. All data points currently suggest that will be the case.
Maybe, just maybe, Chinese gold premiums rebounding might indeed be predicting a rebound in the price of gold.


