In the midst of bad press against China it is easy to get caught in the endless stream of negative headlines. However, staying unbiased and factual is a key success factor. With this mindset we will do our China stock market outlook for 2019.
[Ed. note: this article was originally published on September 21st, 2018. The editorial team continuously adds important updates throughout 2019 to followup how our initial outlook with forecast performed. Scroll down to read the latest updates published in 2019.]
When it comes to this China stock market outlook for 2019 we believe we are able to do a very accurate forecast even if China’s market is not always transparent. The index we use for our analysis is the Shanghai Composite Index (SSEC).
China stock market outlook pitfall: bad press is a lagging indicator
First, however, it is important to note that we are publishing our China stock market outlook for 2019 at a time of of peak negative sentiment. Right now, literally all news outlets, financial mainstream media and finance blogs are full of pessimistic and disastrous, almost apocalyptic, forecasts about China.
One thing they have in common: stay away from Chinese stocks.
This really is a very risky moment in time to publish a China stock market outlook for 2019 and beyond.
If you look at some of recent headlines you will wonder who in this world may still be buying stocks in China.
Trade War Escalates. Stock Markets Shrug. Here’s Why. (New York Times)
China retaliates against new US tariffs as trade war escalates (Financial Times)
Trade war: Trump accuses Beijing of election meddling amid flurry of tariffs (The Guardian)
Dow, S&P 500 records belie festering fear that China and the U.S. ‘are on a collision course’ (MarketWatch)
China and Hong Kong stocks fall as US set to slap US$200 billion in tariffs on Chinese goods (South China Morning Post)
This is only a subset of the current headlines where we applied the filter ‘only very large sites’.
And in case you were not scared away, having still some last hopes with this week’s relief rally of almost 4%, then you would encounter this headline: The stock market may be getting it wrong by rallying in the face of new U.S.-Chinese tariffs. Indeed, this would crush every hope that’s left.
So are we really sure this is the right time to publish our China stock market outlook for 2019?
Surprisingly we found a lonely voice suggesting that trade war pessimism creates buying opportunity for China stocks. Interesting, there is still someone left with some sound thinking?
Here is the point we are trying to make: media is a lagging indicator. It is even ‘worse’: media is a contrarian indicator when it reaches extremes. In other words, the more media talk about a stock, market, asset, the higher the probability the tide is about to turn.
Case in point: when all media were talking about cryptocurrencies at the end of last year it was clear the peak was in.
Similarly, at the depth of pessimism in media, where 99 pct of media attention is as bearish as can be we believe there is a very high probability that the market has already decided to go higher.
Always be careful with media, it is a lagging indicator, certainly understood in this way by smart investors.
From a factual perspective we see that the portion of implemented vs. announced tariffs is surprisingly low. President Trump is known to be a great negotiator with his direct style to take control over situations. This China trade war situation is presumably no different.
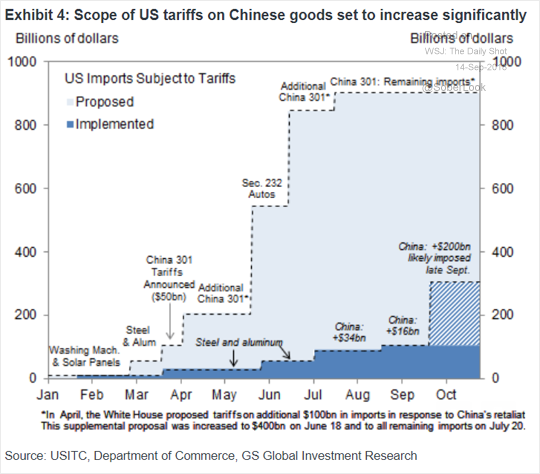
Now in order to really understand what the real effect is of this tariffs story on our China stock market outlook for 2019 it is mandatory to quantify this. Let’s forget about the fears that these stories try to create among investors, and only look at the facts and figures.
Here is the really important point: we did calculate the real effect of the implemented and forecasted tariffs. Note: not any of the articles we mentioned above quantified the real effect. They only create fear and link this fear with stock prices.
The GDP of China was $12,237.70B in 2017. The $200B tariffs represent 1.6%.
The GDP is growing at an annual rate of 6.7% which is $820B per year as per China’s official forecast. The $200B tariffs represent less than 20% of the annual growth rate, it is the growth of a bit less than one quarter without touching the base GDP.
Given the sell off in China’s stock market that started 7 months ago we believe the real effect of the tariffs, assuming the $200B will be implemented, is priced in. Moreover, the sentiment effect has already been largely priced in, and likely has bottomed because smart investors take decisions based on the facts and figures, as explained above they understand that the correction includes the tariffs effect.
That’s why we believe China’s stock market is setting a major bottom now, as things stand today, not taking into account any new evolution and new announcements from both countries.
China stock market outlook leading indicators: SSEC chart and Euro
The most important leading indicators which smart investors are monitoring closely: the monthly chart of the Shanghai Stock Exchange (SSEC) as well as, surprisingly, the Euro.
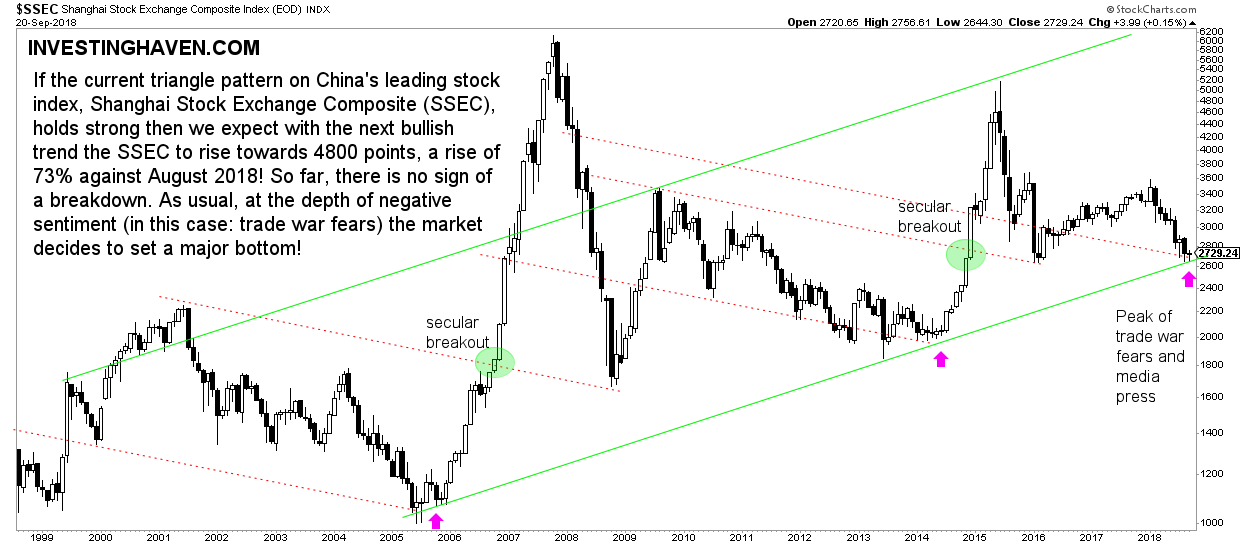
First, the SSEC embedded at the bottom of this article is visibly at a major support area. Similar to the 2 other instances in which it dipped to its rising long term trendline we believe it may stay there for 2 more months before it starts a monster rally.
In both previous instances it consolidated for around 6 months before it rose very strongly. Once it went up more than 6-fold while in 2015 it went up almost 3-fold.
The flipside? In no way do stock market bulls want to see the SSEC close below 2700 points at the end of the coming months.
It may not be visible on this chart but the lowest support line on the first chart goes back almost 30 years. It really is an important trend.
The second leading indicator for our China stock market outlook for 2019 is the Euro. Any surprise here, probably yes as it’s not a conventional indicator.
The next chart shows the long term Euro chart overlayed by emerging markets (EEM) in light grey. It’s not a simple chart to read, and we have spent really a lot of time setting this up. How to read this?
- The Euro is leading as major turning points on the emerging markets chart coincide with major turning points on Euro’s chart (not necessarily the other way around).
- These crucial ‘events’ in emerging markets (major turning points) are indicated with the grey circles.
- Every of these turning points coincide with major support or resistance on the Euro’s long term pattern: a breakdown from an in-pattern structure or breakout. See the green circles.
So major turning points in emerging markets coincide with major ‘events’ on the Euro chart specifically on Euro’s chart pattern(s).
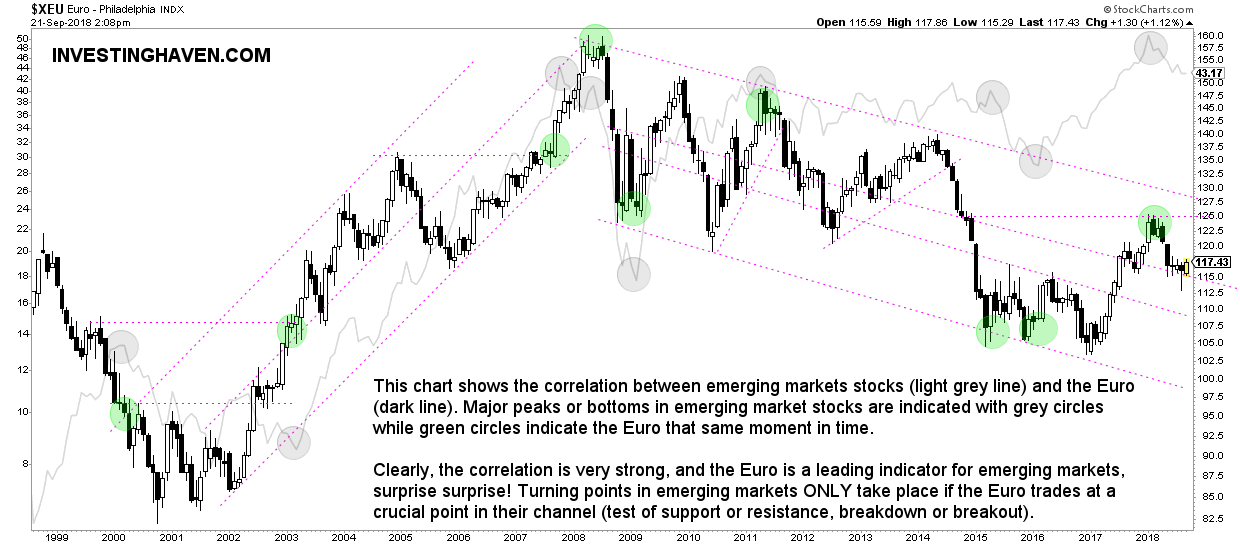
What we conclude after analyzing this chart in detail as well as the current global market landscape is the following: global stock markets are in ‘risk on’ mode (the US more than Europe), the Euro is not in a strong bullish nor bearish trend right now, the peak of emerging markets in January of this year coincided with the Euro being stopped at its 2014 (crude oil crash) breakdown point with no other major ‘event’ in any global market. Since then, also on the Euro chart, no major trend up or down started.
This suggests, according to us, that currencies, which are the cornerstone in financial markets and tend to determine dominant trends, is going to act as a catalyst for global and emerging markets, but also China’s stock market in particular.
Our China stock market outlook for 2019, with our forecast
Only the above data points are the ones we deem relevant and mandatory for our China stock market outlook for 2019. No need to spend days and weeks in fundamental analysis, economic ratios and indicators, and so on.
We conclude that the Euro, leading indicator, will be a catalyst for China’s stock market and that bad press as a lagging indicator has probably peaked. This implies that hardly anyone believes that China’s stock market can go higher, a great environment for the bull to resume.
That said, with the SSEC chart setup, we are on record with our China stock market outlook of 4800 points in the SSEC for 2019 or 2020, a 73% rise against current levels.
Obviously, this forecast assumes the bearish story does not develop. Stated differently, the SSEC cannot close the coming months below 2600 points. If so, the bearish scenario will play out, though we deem the probability lower than 10 percent.
Followup on our initial China stock market outlook throughout 2019
** Update on January 13th, 2019 **
[Ed. note: this paragraph was added in the 2nd week of 2019 just to followup on how our China stock market outlook published 5 months is performing.]
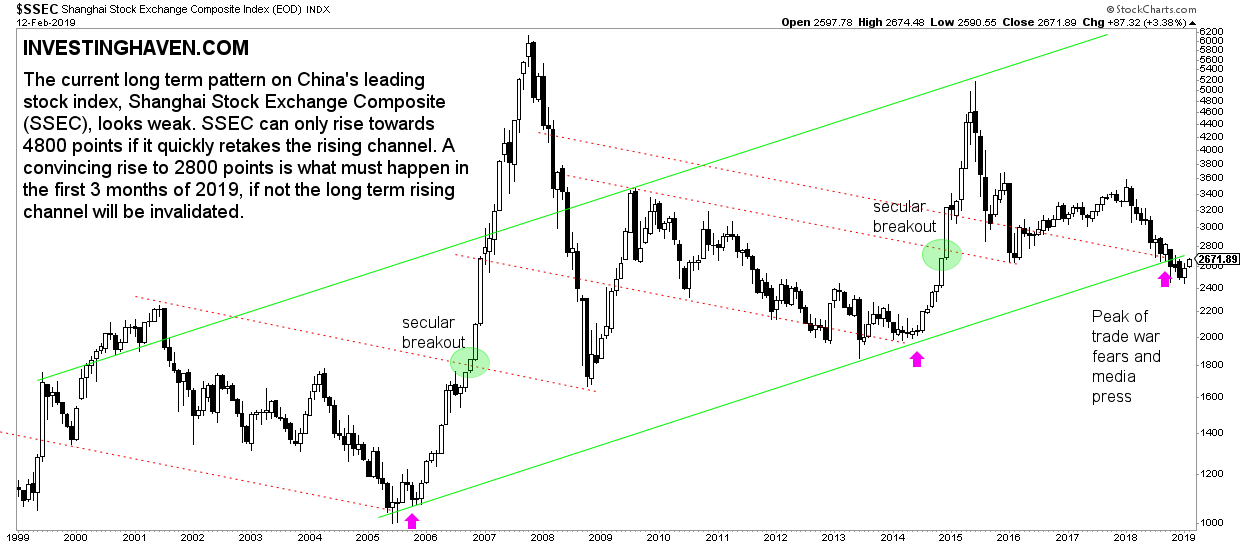
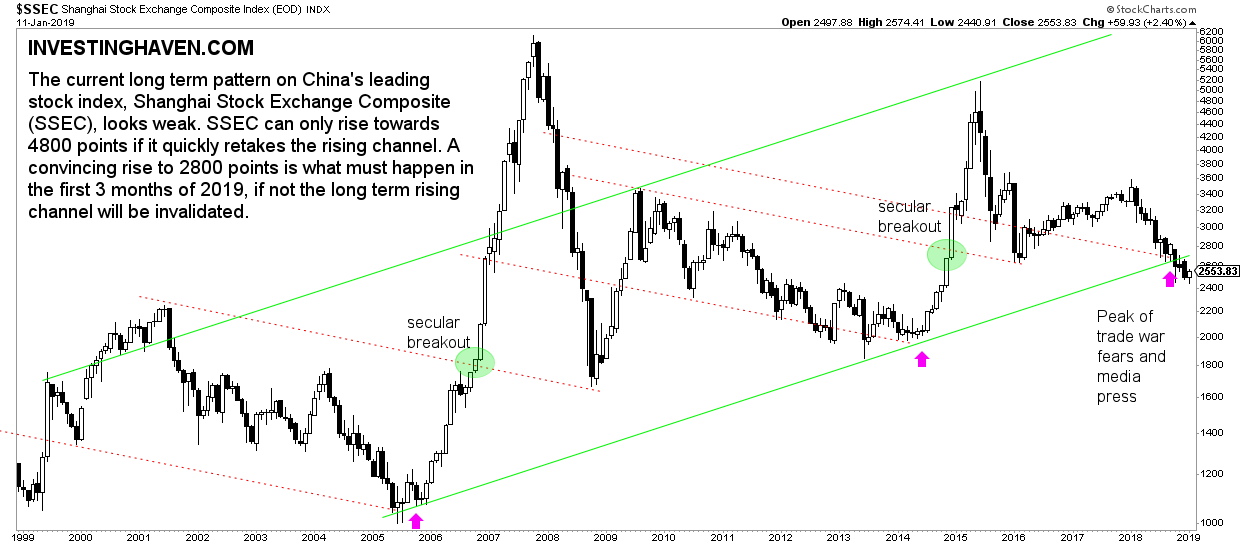
This up-to-date chart of China’s stock market index SSEC looks weak as 2019 kicks off. As said on the annotation the current long term rising channel is being invalidated. In order for Chinese stocks to become bullish again, or at least not bearish, the SSEC index representing Chinese stocks must urgently go back to 2800 points. If not the rising channel will be invalidated, and it would be much more open to downside potential.
** Update on February 13th, 2019 **
In recent months everyone thought it was the end of China’s economy and stock market. The press on China’s stock market was so bad that the bearish stock market outlook for China became ‘a given’.
However, with our contrary nature, we flashed a major buy alert saying that we were close to a major bottom somewhere a month ago. It now appears, early February 2019, that we were spot on with this contrarian forecast!
Indeed, InvestingHaven is on record with a bullish outlook on China stocks. However, there is a condition tied to this bullish outlook.
The monthly chart of the Shanghai Stock Exchange Composite is embedded below. Is the most up-to-date chart at the time of writing which is mid-February 2019. This chart shows that its price is almost back in its bullish area (rising channel).
We have seen a similar situation in 2005 when prices dipped below the bullish channel for a couple of months. The fact that prices fall outside of a falling channel is a reason for concern, but we always apply the ‘rule of three’ which means 3 monthly closes do matter. In the case of China’s stock market we saw 2 monthly closes right below support, 2 monthly closes significantly below support, and this month coming close to support again. Taking this context into account we have not had the situation of 3 montly closes below support.
The next few months will be critical! As soon as the SSEC rises back in its channel we want to see 2 to 3 monthly closes within the rising channel. If that were to happen we consider it a confirmation that our 4800 target is underway, likely not in 2019 but one or two years later.