
At start of each month we take a thorough look into the monthly chart of our 15 leading indicators which determine global market trends. As April 2019 kicks off we start seeing a new trend, one that favors global stock markets especially emerging market stocks! As per our 100 investing tips for successful investing the dominant trend is by far (!) the most important thing to watch, and it determines the direction of many markets in a 6 to 18 month time period. Visibly, capital is flowing into stock markets, especially emerging markets. Smart investors do not ignore this, and position accordingly.
This is the conclusion after analyzing the 15 leading indicators, their patterns and how they have evolved ‘against each other’ as April 2019 kicks off:
All global stock markets now have a BULLISH look again, first and foremost US stocks and emerging markets stocks. There are still no signs whatsoever of a 2008-alike scenario, no doomsday scenario in 2019, even though many were predicting this a few months ago (we continued to firmly deny this scenario based on our chart set and methodology). What makes us pretty confident is that the Euro and Dollar are not showing any concerning sign as per our proprietary bear market criteria. Commodities are neutral, select commodities will do well in 2019 because inflation seems to be setting a giant double bottom. Gold’s major test at $1400 failed, but it might be picking up steam for another attempt.
Make no mistake. This is crucial information. It determines which markets will do well in the second part of 2019, starting in April or May.
Note that the doomsday crowd was, once again, horribly wrong. We got so many messages from readers suggesting a 1987-alike scenario or even 2008-alike scenario was about to happen.
Our reply was simple. We went back to 1987 and looked at the chart setup based on intermarket dynamics. Our methodology did spot a major move was brewing in the summer of 1987 as reported here 5 Shocking Charts From 1987: No Similar Market Crash In 2019. However, in January of 2019 there was no sign whatsoever of any crash-alike scenario. We sticked firmly to our observations, and showed trust to our method. It proved to be spot-on, once again!
Learning? Be very, very careful with the doomsday crowd and their writings, they may hurt your financial health considerably!
These are the price points we are closely watching in our set of 15 leading indicators as April 2019 kicks off:
- Currencies and credit markets: the most important observation at the start of April 2019 comes from credit and currency markets. Treasuries in the U.S. haven fallen to their 2.50 level which we identified many months ago as the line in the sand. So far, this is supportive of a stock bull market. We closely watch the Euro below 112 for a risk-off signal which we do not expect based on the current course of things.
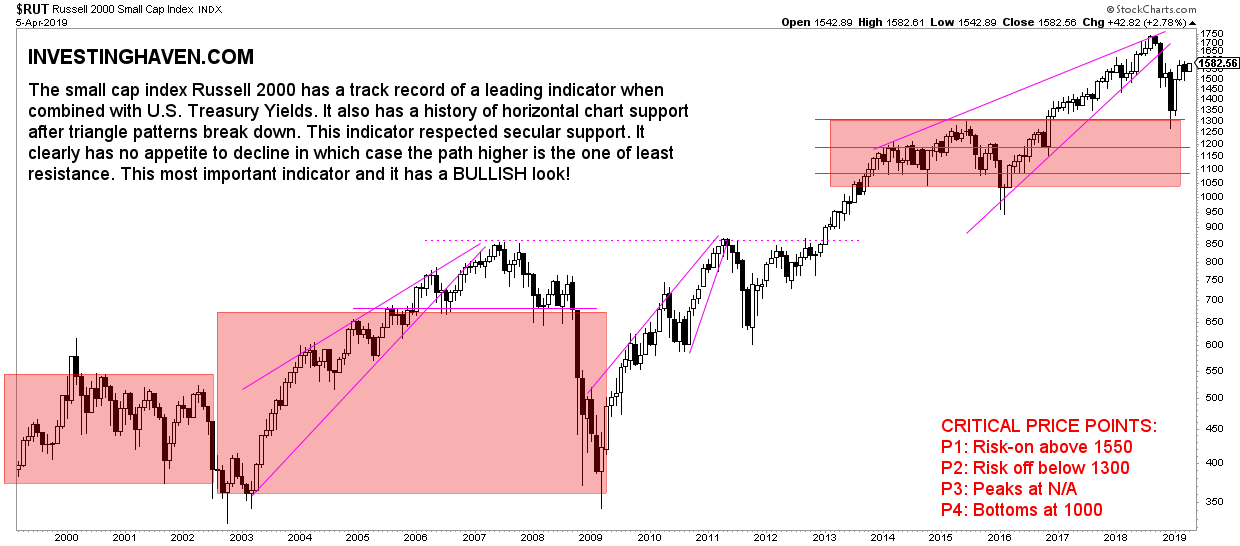
- US stocks have rebounded and are continuing their uptrend at the end of March. “A small push above current price levels would turn stocks very bullish,” is what we said early March and is what we got early April. Leading indicators are the Russell 2000 (RUT) and 1600 points is the line in the sand for a bullish continuation, NYSE with 13,100 being the bullish price level. above these price levels we will see bullish momentum.
- Emerging markets (EEM) are on their way to become super bullish as they confirmed their giant breakout from 2017, and likely have ended their tactical bear market of 2018. We also watch Shanghai Stock Composite Index (SSEC) to get a confirmation that China’s stock market ended its downtrend.
- The gold (GOLD) safe haven trade is set to morph into an inflation trade. The monthly close right below $1,300 suggests it needs to pick up steam before it can move higher. This is a very common phenomenon in the gold market. Below $1,250 would be concerning for the short to medium term and might invalidate our gold forecast.
- Visibly, crude oil is supportive for stocks at a minimum for the next 3 to 6 months!
- Inflation is supportive for stocks and several commodities, for a long period of time presumably.
The 2 Stock Market Charts That Stand Out
US stock markets as per our leading indicator for US stocks (Russell 2000):
Emerging markets stocks, by far THE most bullish stock market chart (also bullish news here and here):


