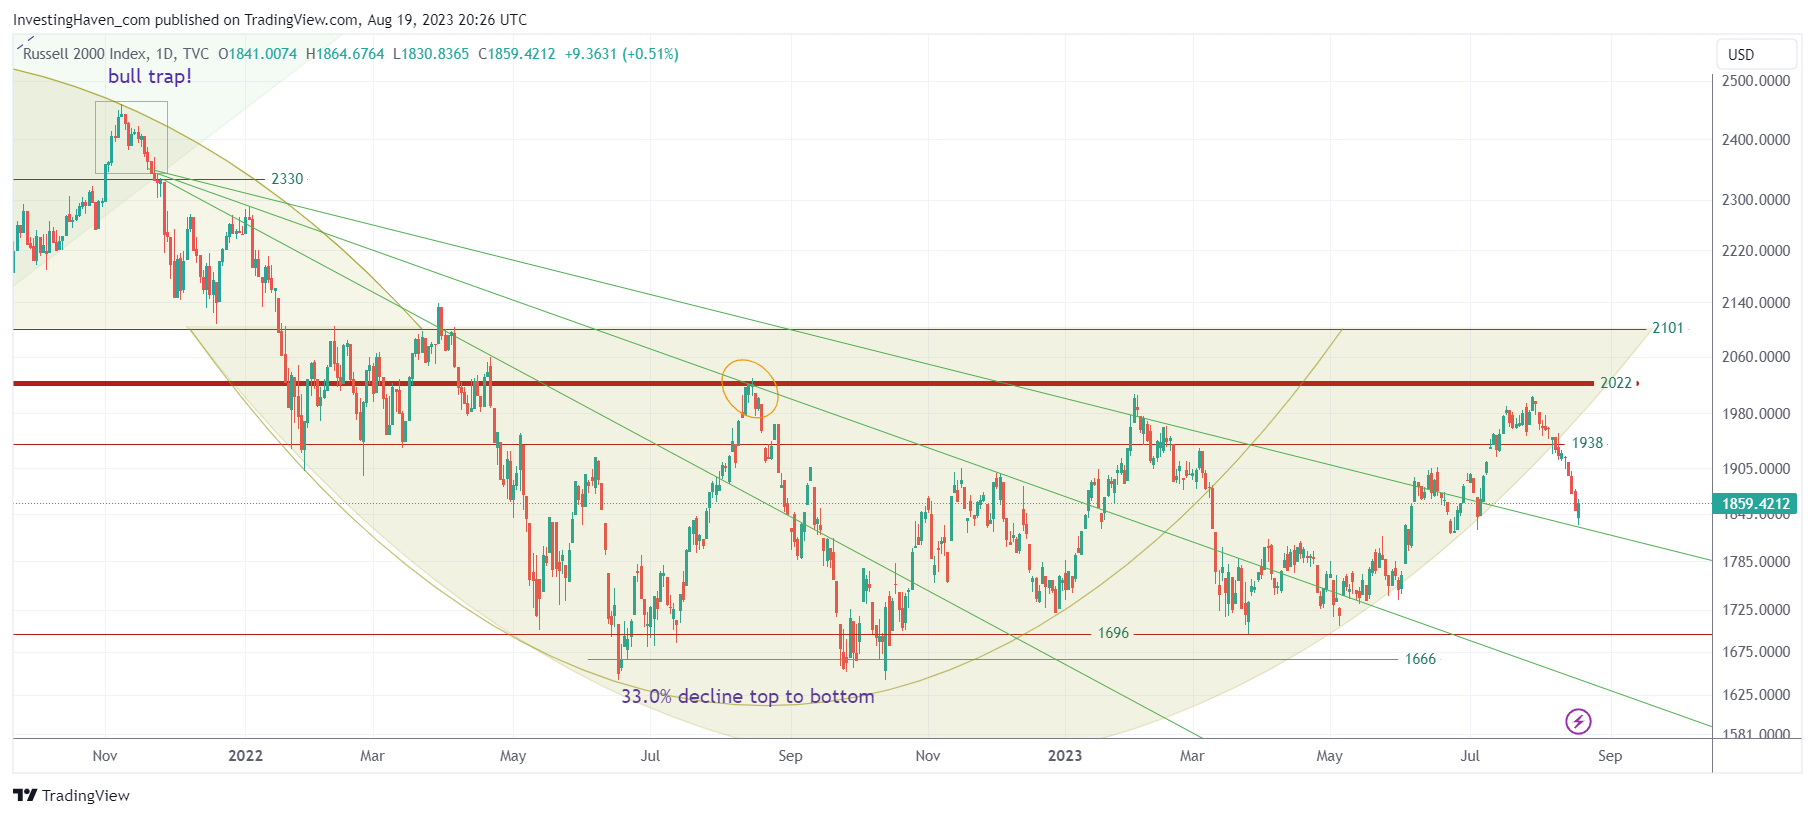
Can we expect an end-of-year rally in 2023? The short version of our answer: “Yes, we do expect an end-of-year rally in 2023.” Specifically, we predict that bullish momentum will kick in not later than mid-October of 2023. However, the market has to resolve short-term uncertainties first, as evidenced by the violation of the bullish formation on the chart of the Russell 2000, a leading indicator for broad markets.
We start with the uncertainties that the market has to go through in the short term.
We then look at timeline analysis insights, as well as anchor points that will confirm whether our forecast is on track. We add historical evidence, and also invalidation criteria to know when our end-of-year rally forecast will invalidate.
Note that this current article offers complementary insights with What Is The Expected Trend Of The Stock Market In 2024? Moreover, the underlying assumptions of this article are that there is no secular bearish turning point in 2023 which implies no market crash in 2023.
Leading indicator: Short-term warning sign
A captivating plot twist emerges as we delve into the world of small cap stocks. Intriguingly, these stocks have veered off their projected bullish reversal pattern, triggering curiosity and raising pertinent questions.
Dissecting the chart, a glaring violation of the 18-month rounded pattern becomes apparent. While this makes small caps vulnerable, it’s vital to note the existence of robust support levels that act as a safety net against a complete breakdown. Caution is warranted, especially within the range of 1700 to 1800 points. Dropping below 1700 points could usher in concerning conditions. Alternatively, hovering above 1700 points might herald a consolidation phase that will test the mettle of market participants.
Timeline Analysis: High probability of an end-of-year rally 2023
One key facet to consider is our meticulous timeline analysis. Over the next six weeks, a certain level of volatility and market choppiness is anticipated. Buckle up for a volatility spike, which we believe will be followed by a rebound. Unlike the turbulence witnessed in the preceding year, September’s dynamics are poised to be relatively more stable.
Moving ahead, the time window from mid-October to mid-December appears promising. However, it’s important to note that sector rotation and transient momentum are likely to dominate this phase. Not all stocks and sectors will move in sync, hinting at a nuanced and multifaceted market landscape.
Anchor Points: Conditions for an end-of-year rally 2023
Anchoring our viewpoint is the analysis of critical anchor points. Notably, the breakout levels that materialized in June within the S&P 500 and Nasdaq charts hold immense significance, particularly 4220 points on the S&P 500 index. These levels are poised to serve as a bedrock of support, instilling confidence in the market’s inherent resilience.
Historical evidence of an end-of-year rally
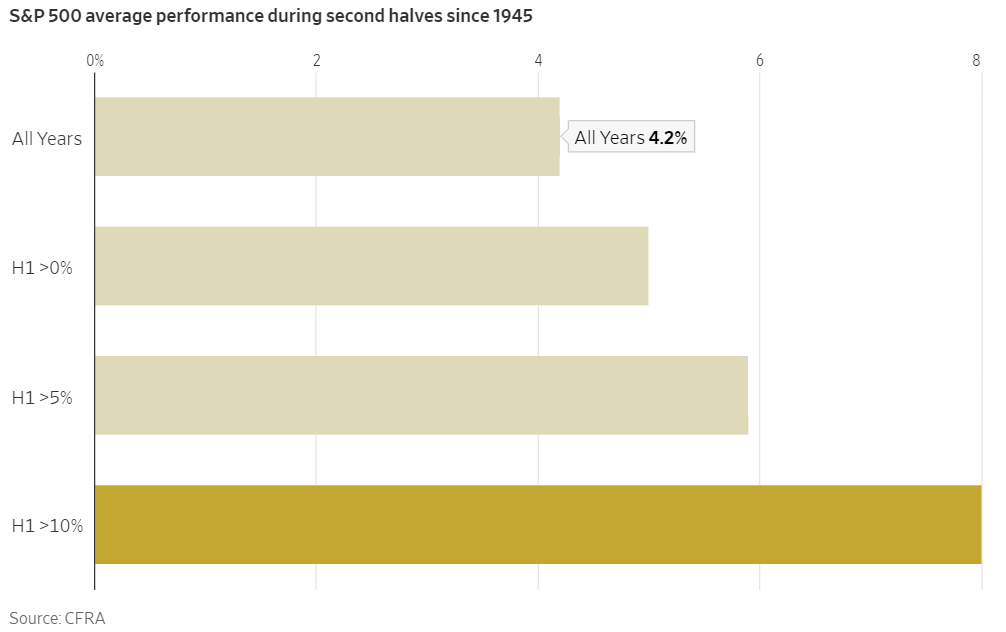
The WSJ published some historical data, highlighting probabilities of an end-of-year rally after a good start of the year (first 6 months):
In the stock market, a good first half is usually followed by a good second half.
After a strong first-half performance, the S&P 500 is historically more likely to rise in the second half and tends to notch bigger advances, according to CFRA analysis.
The S&P 500 has gained an average of 4.2% during all second halves since 1945, rising 69% of the time.
When the S&P 500 is coming off a first-half gain of 10% or more, the broad index on average adds 8% in the second half and moves higher 82% of the time.
Invalidation factors
From our weekend analysis, exclusive to Momentum Investing members (deep analysis of broad markets, trends, our favorite sectors, in total 3000 words):
While our outlook leans towards optimism, we mustn’t disregard potential invalidation factors that could reshape the narrative. A pivotal anchor point to monitor is the VVIX at 114. Should this threshold be crossed, especially surging past 128 points, the specter of heightened volatility looms large.
Another crucial anchor point is the 2-Year Yields at 5%. This level carries weight for sectors sensitive to interest rates. A persistent rise beyond 5.2% could exert substantial pressure on equities.
Conclusion
2023 unfolds as an intriguing chapter in financial markets’ history.
Grounded in deep analysis and shaped by historical data, our forecast confidently foresees an end-of-year rally in 2023. However, seasoned investors recognize the art of risk management, where optimism is complemented by a prudent dose of realism. The path ahead may will start with unpredictabilities, yet our informed perspective provides guidance.
Anticipating an end-of-year rally in 2023 isn’t just speculation; it’s a calculated projection grounded in the intricate dance of market forces.
Get access to our premium weekend analysis: analyzing current trends in markets, featuring end-of-year opportunities across our favorite sectors: This Is A Buy & Hold Environment For Quality Stocks And Some High Growth Stocks. This report is available in the restricted area, after signing up, it is a guide for the end-of-year rally which we anticipate to start in the next 6 to 8 weeks.


