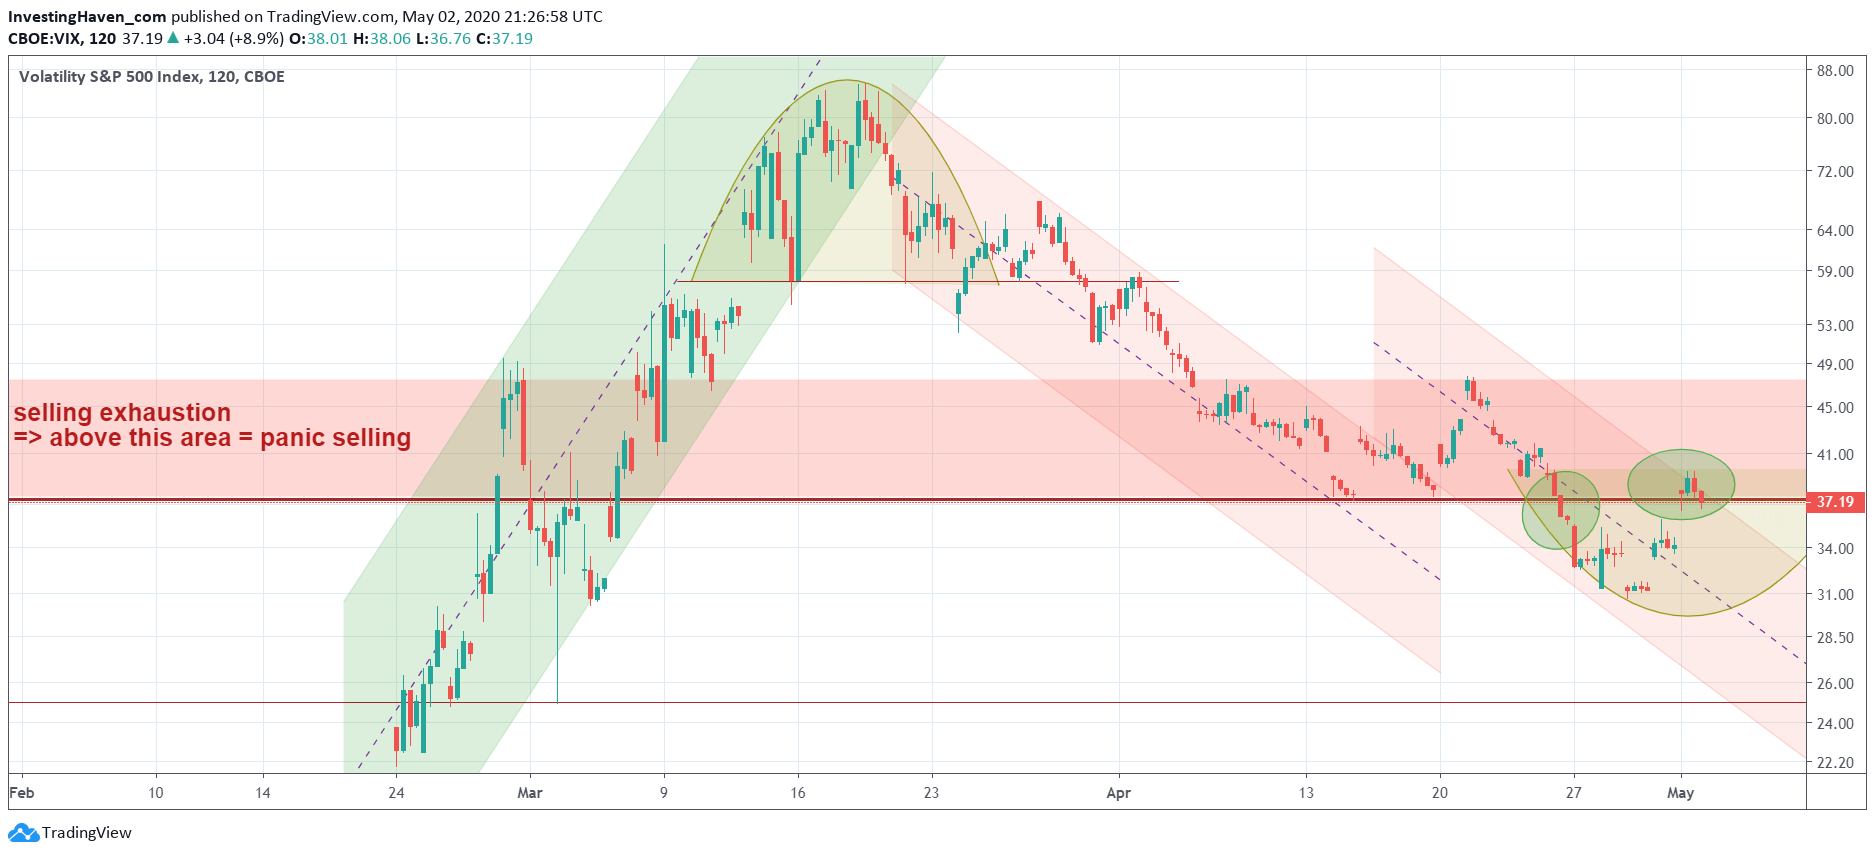
Markets continue to be extremely challenging. Anyone who had exposure to markets last week knows exactly what we mean. Volatility continues to be very high, and leading indicators continue to open and close most trading days ‘on the edge’. Markets are almost ‘designed’ to mislead and confuse. A very, very solid method is required to beat these markets. Our leading indicator analysis is helping tremendously to get our positions right in recent months!
Recently we wrote multiple articles about our leading indicators, which may be considered a teaser of our premium services work:
Leading Stock Market Indicator: A Hopeful Sign
Crash Indicator At Make Or Break Level
The Most Promising Stock Market Indicator
One of our leading indicators is the VIX index.
We are not going to reveal all the details of below chart as we did share them in our research service. Suffice it to say that this index continues to mislead with a false breakout on Friday, a weekly close right below a bearish level in the last few minutes of the week, and a potential reversal pattern.
The ‘good news’ for long or medium term investors is that VIX is now falling below its ‘armaggedon’ area. Note that this is clearly the intention of this indicator, it may turn up any time is what below chart suggests.
How to play these markets in the short term? Either on the long side or short side, it doesn’t really matter, but the long side looks to have a bias until proven otherwise (this is subject to change on a day by day basis). It really requires a solid leading indicator method combined with an algorithm that has stood the test of time.
How to play these markets in the medium term? By identifying the solid long term trends, and taking medium term positions.


