Being successful is all about identifying the right leading indicators combined with the assessment on probabilities for future outcomes. That’s our key premise as discussed in great detail in our 100 investing tips. We applied this in our monthly monitoring of our 15 leading indicators which we use to forecast global markets. We consider the EURO the most important asset in global markets which is why it pays off to continuously monitor where it is heading. The message of the EURO chart right now is clear: risk on. Go stock markets and risk assets! Certainly no stock market crash to see anywhere!
How To Forecast With The Euro
When combining chart analysis with intermarket analysis we get a very powerful combination. It helps understand to which assets capital is flowing.
In doing so we combine two crucially important investing principles. The first one:
The art of understanding intermarket dynamics is the combination of 3 things: identifying leading assets + reading charts of those assets and respecting chart characteristics of each asset separately + identifying major turning point for each asset. Once this is in place it becomes obvious which asset has a primary or dominant force influencing other assets. This is what we derive from intermarket dynamics, and this is the key to forecast markets.
Moreover, and further to the previous principle:
All major moves in markets, especially market crashes, start with major turning points in credit and currency markets. That’s why 10 and 20 year rates, as well as leading currency pairs, have the most influence on all other markets, including stock markets around the globe.
In other words we have to check currency and credit markets first, understand where they are in their dominant trend(s), and hold this against other asset classes and markets.
The Euro Chart Says It All
In a top down approach we always start with a monthly chart.
One extremely important chart related note is that currency charts, similar to commodities charts, are very complex in nature. That’s because they tend to combine horizontal with diagonal trends. So the EURO chart requires thorough analysis.
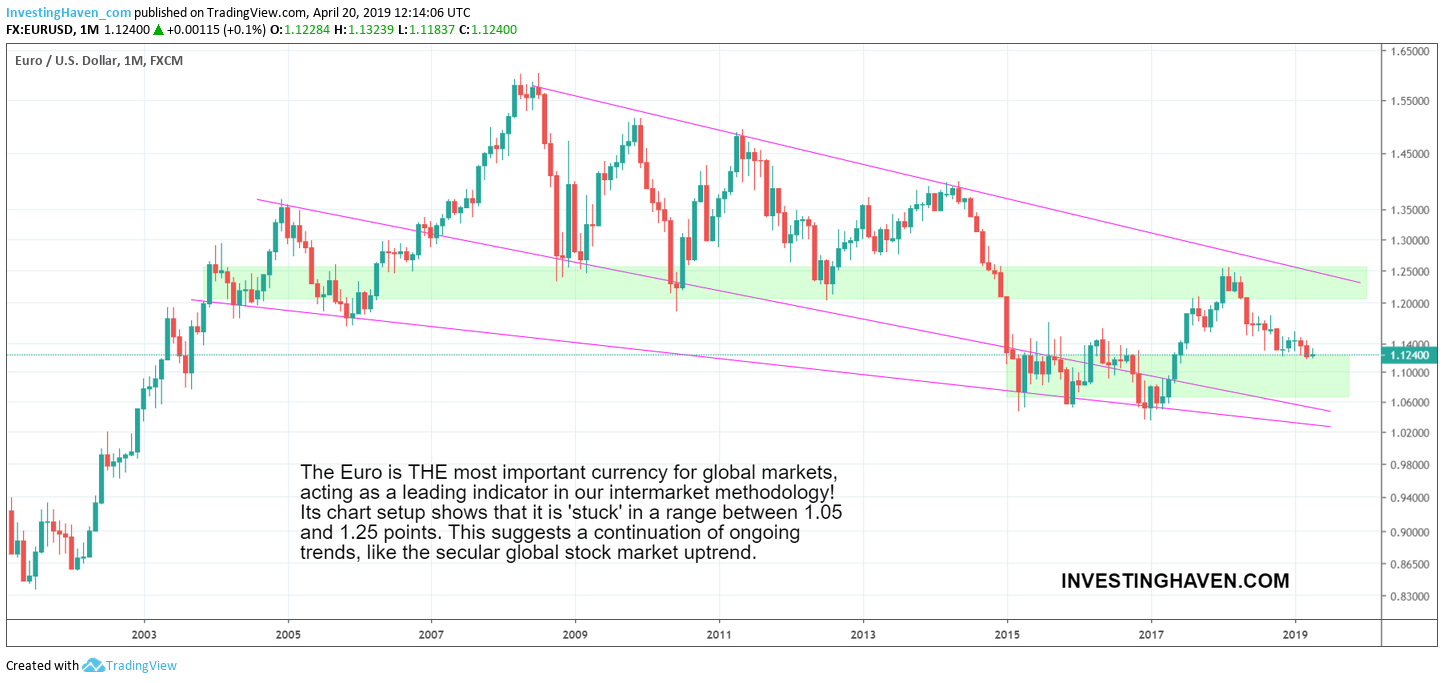
The monthly Euro chart has a clear setup:
- A falling channel since the financial crisis.
- It has the form of a falling wedge.
- Horizontally, there is major support in the 1.05 to 1.10 area.
- Similarly, the resistance in the 1.20 to 1.25 area is giant.
The EURO is now moving in the falling channel somewhere in the center, near major support.
What does all this mean?
That there is no major move brewing. Even if the EURO rises or falls, it has plenty of support as well as resistance nearby. So we can reasonably expect a continuation of the current trends in global markets.

Risk-On Trend Set To Continue
Already back in January, at the depth of the stock market decline and with maximum pessimism, we stood strong. Based on our leading indicators, first and foremost the EURO chart, we concluded this (quote from January):
The general picture is that all global stock markets stopped falling right above major support. No major harm done yet, no signs of a 2008-alike scenario as of yet. The picture does not look bullish yet. It can go both directions, but at this point in time the bulls have the benefit of the doubt. The line in the sand: 2.50 for 10 year rates, 110 in the Euro, 1300 in the Russell 2000.
Since then the picture improved month-over-month, and so were our market calls.
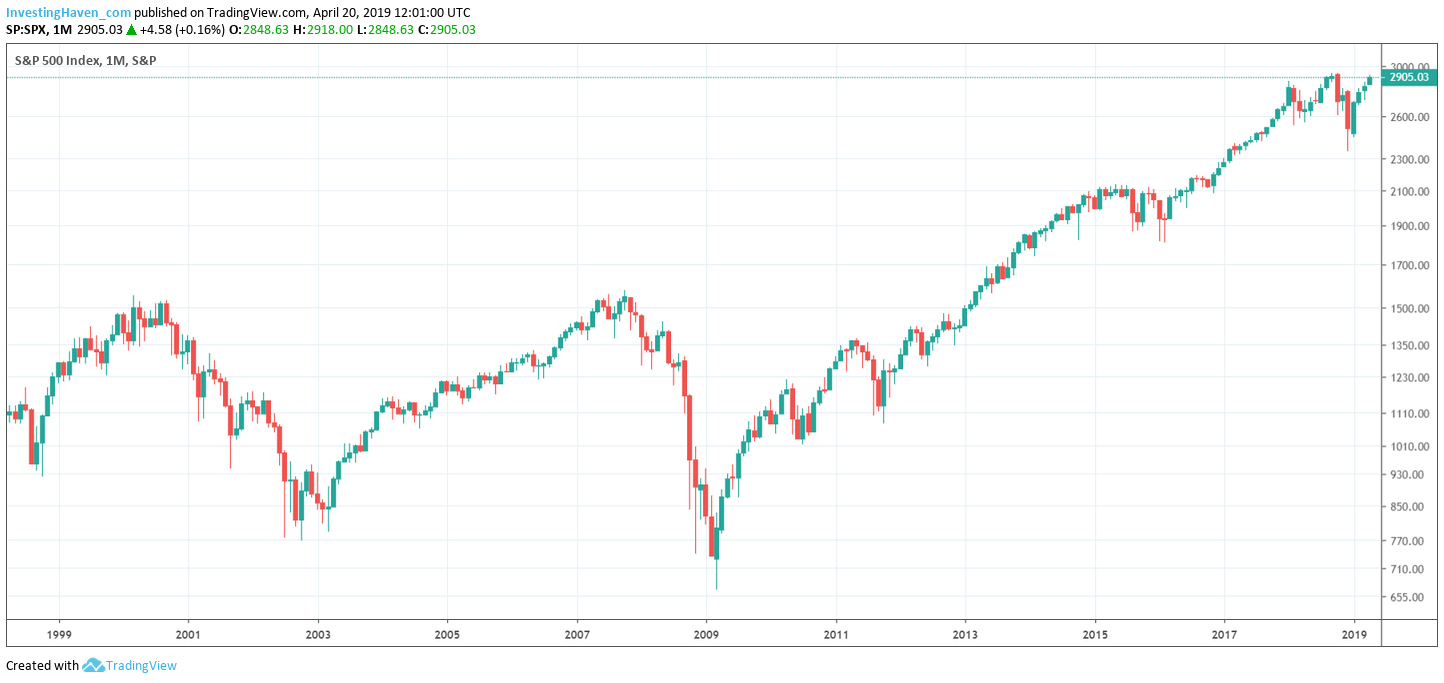
Right now based on the monthly S&P 500 chart it is clear that the stock bull market is resuming. Today’s price is right above the major peak of December 2017 / January 2018.
The combination of the 2 charts in this article clearly suggest that stock markets will continue their rise. It also suggests that high beta stock segments like cannabis stocks and even crypto / blockchain are set to accelerate their rise!


