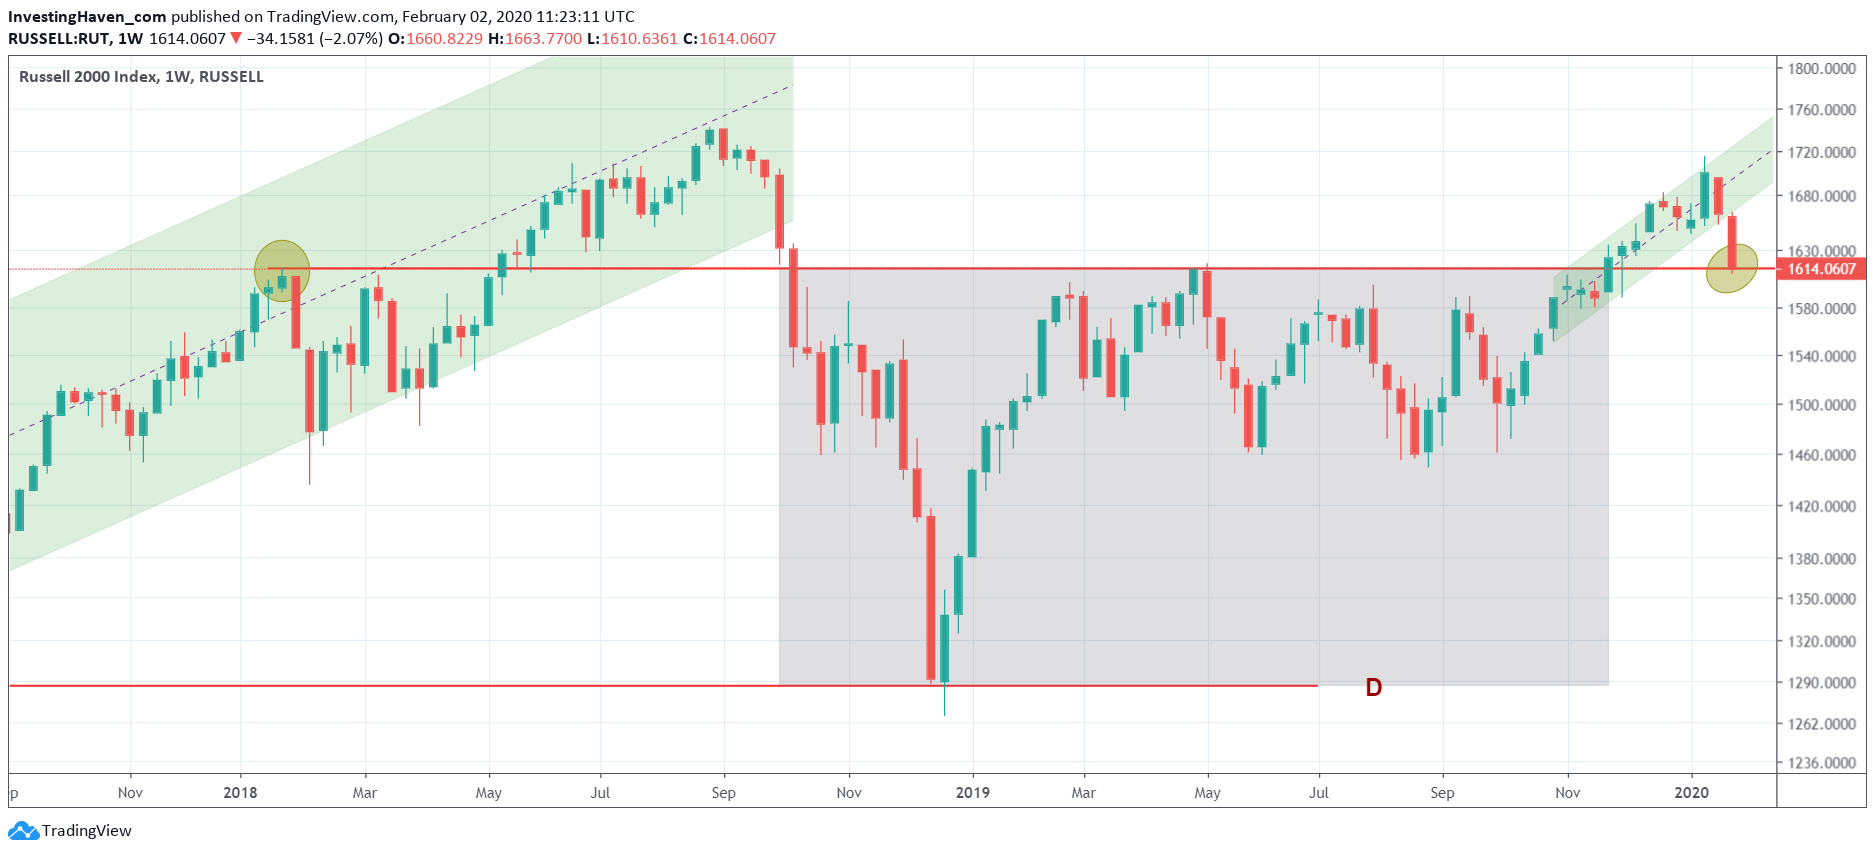
Stocks were ultra volatile in January of 2020. And they ended the month at a make-or-break level. The one leading indicator for stock markets is the Russell 2000 featured in this article. Its chart looks ugly, without any doubt. Yes long term we are bullish on stocks, but short term we forecast more pain.
We already featured the VIX index in this article earlier today: The Most Concerning Chart For Stock Investors In February 2020.
If the VIX goes slightly higher from here we may look at another 10 pct drop in stocks.
Yes there is an opportunity there to pick up our favorite stocks with a discount. However, short term you don’t want to have too much exposure to stocks.
Now that’s exactly what our Momentum Investing methodology suggested: get out of stocks. In our Momentum Investing portfolio which is an official and public challenge to turn 10k into 1M by 2026 we sold our broad stock market position 2 weeks ago. We only hold alternative sectors, and they look ready to explode …. right at a time when stock markets look ready to implode!
The Russell 2000 is our leading indicator for stock markets. It fell exactly to the Jan 2018 highs. It is absolutely fabulous for chartists to watch these points. The red line which was former resistance, and now is turning into support, is one we found a long time ago.
Below is one of the charts from our leading chart library. We don’t feature many of these charts in the public domain, but exceptionally we share one.
We can imagine how the Russell 2000 may fall further in February of 2020 only to invalidate its ‘crash’ and close near the 1614 level at the end of the month. If anything, our members will be the first to know, and will have an edge on adjusting portfolios to reflect the best investing opportunities out there.


