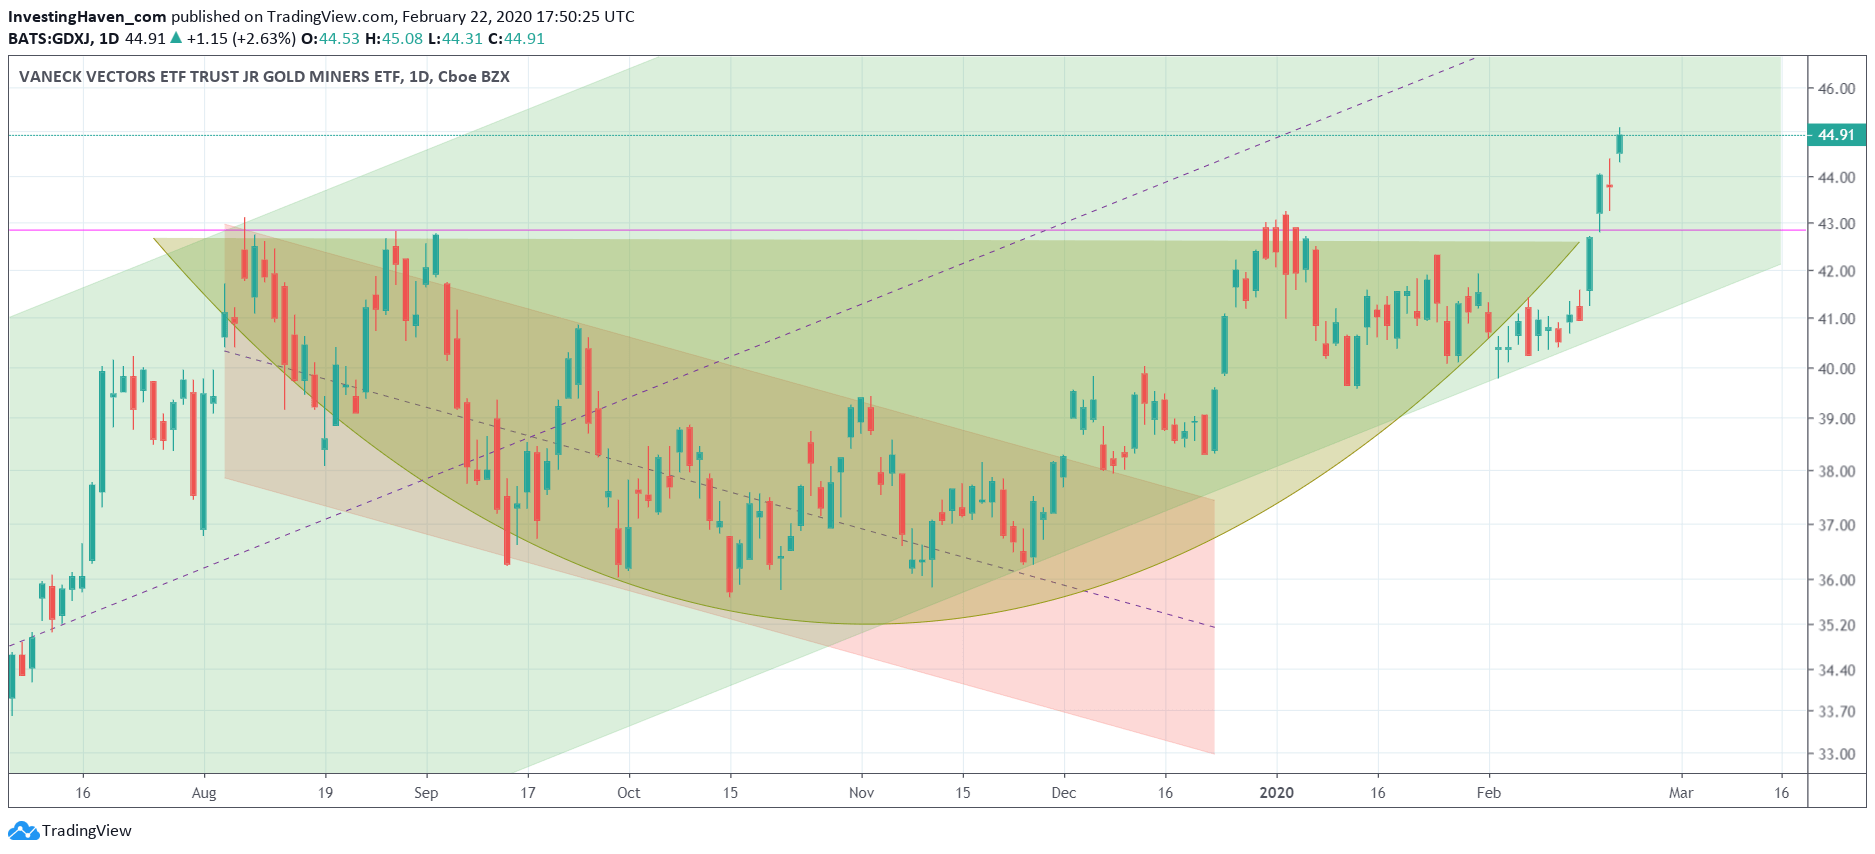
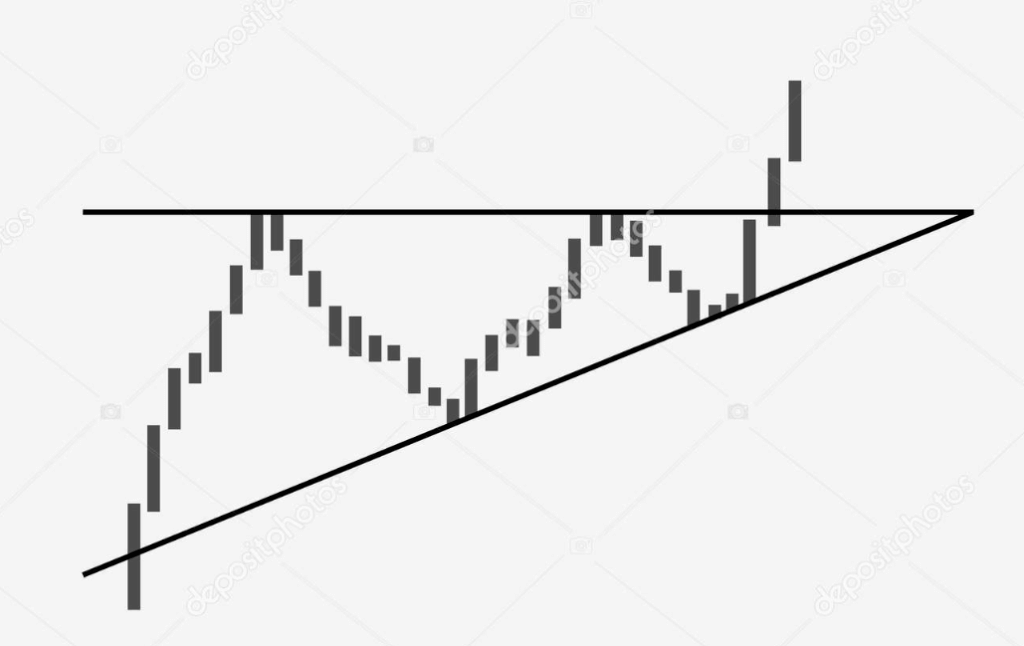
Among the most lovely charts we consider breakout setups to hold the top spot. Especially what we call ‘horizontal breakouts’ deserve the attention from investors. They certainly get our attention, they get our full attention in fact as we continuously research for improved ways to find those ‘beauties’. One of the most beautiful charts at this point in time is the one from junior gold miners. The close-up we feature in this article is a textbook horizontal breakout play. No surprise for InvestingHaven readers as we did forecast this many months ago in our gold prediction as well as silver forecast.
Per our 1/99 Investing Principles it is 1% of the time we should get excited about a specific market. The remaining 99% should be focused on following that market to find that exceptionally exciting time period.
We can apply this principle to the precious metals market. As gold’s price is hitting 7 year highs there must be ‘something’ going on in the gold market.
One of the attractiveness indicators we use to assess the gold market as an investing opportunity is the junior gold mining index GDXJ ETF. That’s because junior gold miners get a bid when gold investors have an outspoken appetite to take risk in the gold market.
The GDXJ ETF now ‘happens’ to break out, and it is our favorite play: a ‘horizontal breakout’. Yes this is one of those few exciting times in the gold market, the 1% as mentioned before.
Below is the GDXJ ETF chart. It is one of the 5 must-see gold market charts we shared in this weekend edition to our premium members. Note that the other 4 gold charts are equally or even more impressive.


