Our palladium forecast 2019 published 4 months ago had this palladium (PALLADIUM) price target of $1375. It got hit last week, in a blow off top fashion. The million dollar question is “what’s next”? We see two possibilities: either a major top was set last week (bearish scenario) or a new raging bull market that will bring palladium ultimately to $5000 by 2020. You read this correctly, and we are very serious that this is a realistic palladium price prediction for 2020: a 3.5x fold rise in the next 12 to 18 months.
We did provide quite some coverage on palladium lately, and it is quite unusual to talk about this precious metals so often as it only appeals to a very small group of investors. Still, this palladium prediction of $5,000 for 2020 will be appealing to many investors.
The reason we give it so much coverage is because of the opportunity we sense. As said 100 investing tips markets work in an asymmetric way: they offer a small number of opportunities which have abnormal returns. This is one of the investing tips from our list of 100:
This cyclical nature of assets and markets results in 2 mega opportunities per year, on average. What happens when applying the investing tip ‘less is more’ to the ‘2 mega opportunities per year’ tip? It pays off to be patient and invest only a part of your capital. The prerequisite, of course, is that you are able to spot those exceptional opportunities.
In order to capture these mega opportunities it requires reading the charts on the different timeframes correctly, but also identifying when an acceleration of the bull market takes place vs. the end of the bull market.
That’s exactly what we do in this article: focus on the potential palladium opportunity of 2019 and 2020, and defining price levels and the conditions to know when this palladium prediction of $5,000 by 2020 will apply.
We review the different timeframes, and even add the longest timeframe (quarterly chart). This way we seek confirmations on the different timeframes to know when we can talk about an acceleration of the bull market vs. the end of the ongoing bull market.
A Palladium Prediction Of $5000 by 2020: Bull vs Bear Market
We said in our palladium 2 entry points article that there are 2 crucial price points on the daily palladium chart: First, the $1270 area is the most obvious point of retracement. It might be an entry point but only provided support holds strong there. If it doesn’t we are looking at $1055 as the second potential entry point.
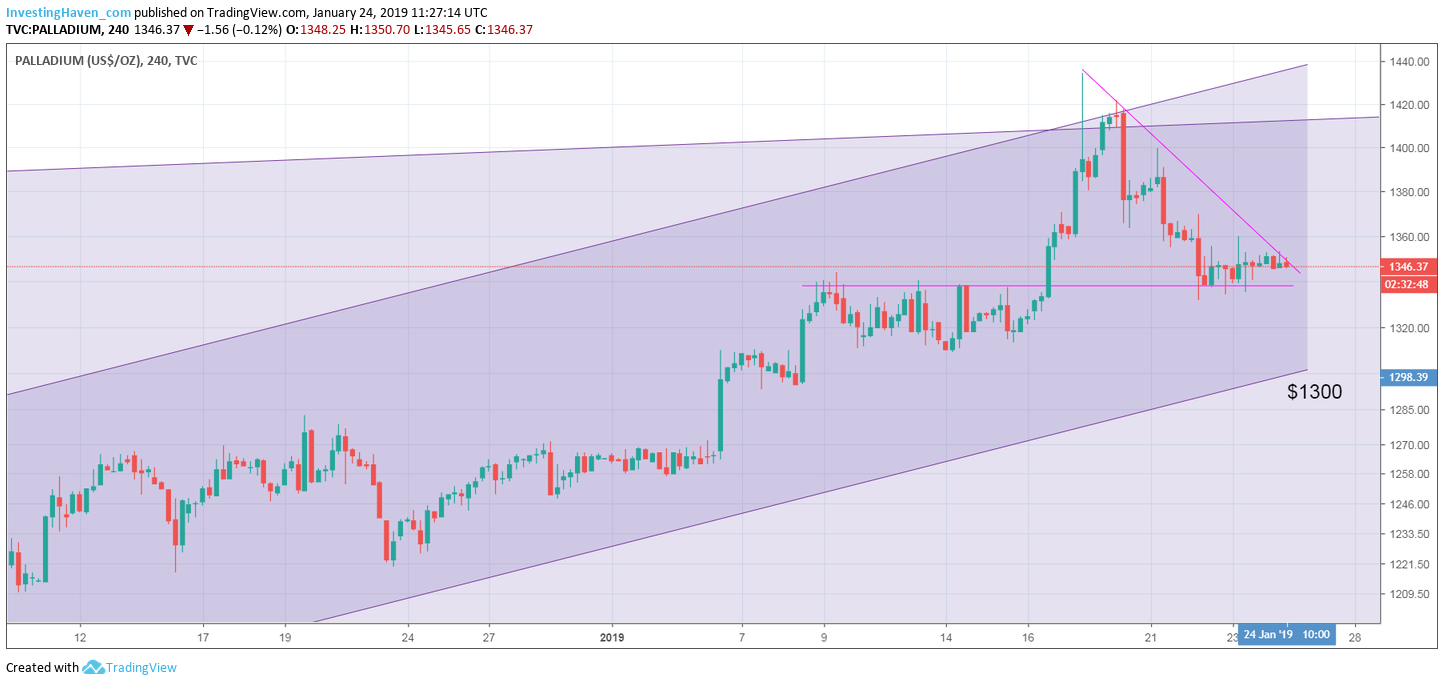
In the meantime the $1270 price level has become $1300.
The point we try to make is that these 2 price points will determine whether the bull market continues or not. Below $1050 it would be the end of the bull market.
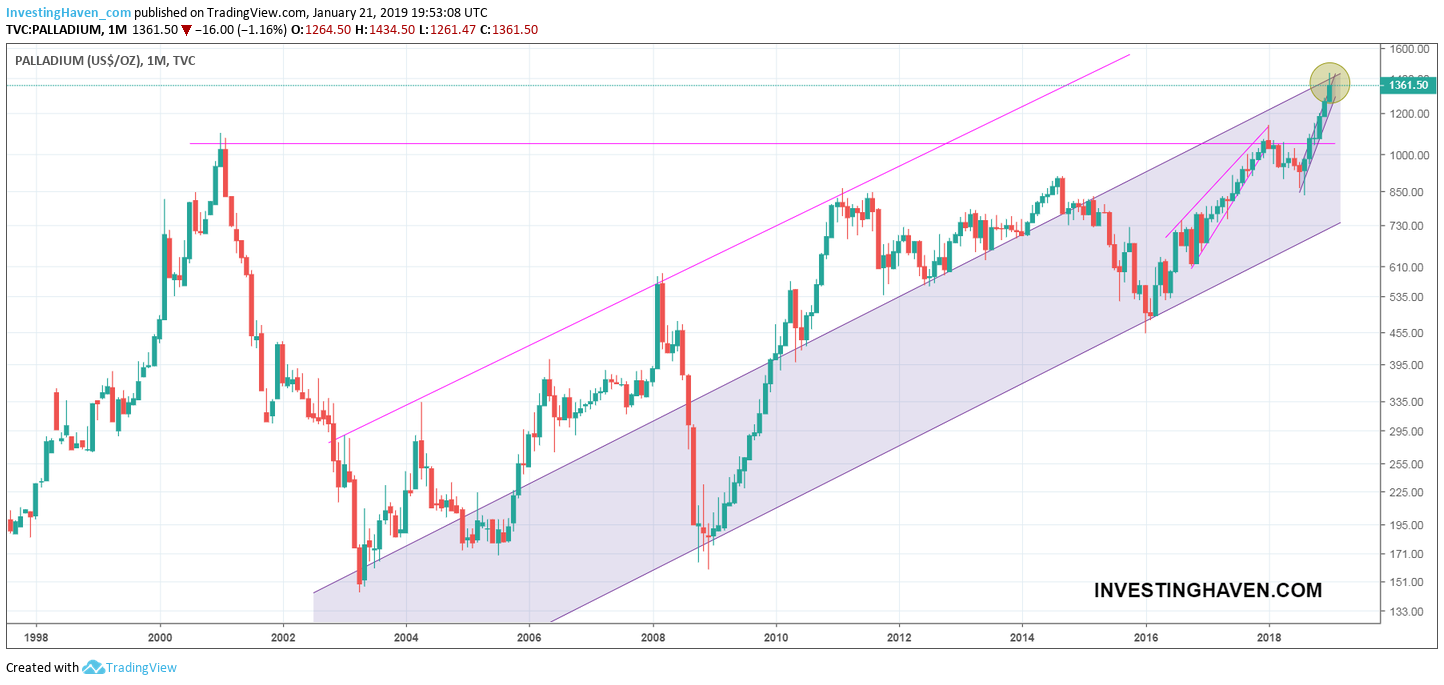
However, when reversing the view, and not focus on the downside but the upside, there might be a raging bull market coming up. This will happen if palladium moves from the lower rising channel to the higher ‘band’ of its rising channel. The monthly chart outlined below makes the point: once above the yellow circle it will be an acceleration of the bull market. That’s the condition, and it is a strict condition!
Why do we believe that $5,000 might be a realistic price target?
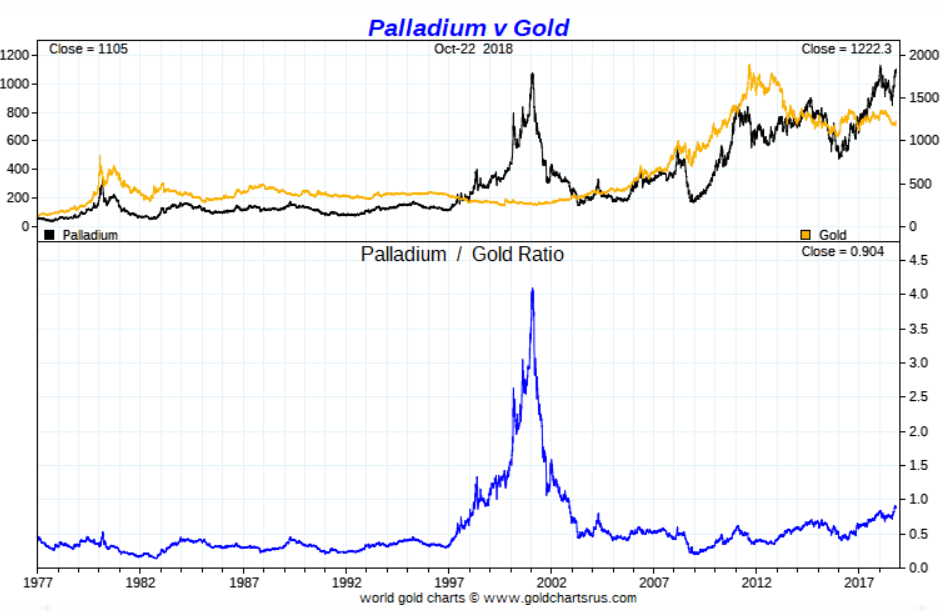
Because of the palladium to gold ratio. In the past, in 1999/2000, this ratio peaked at 4.3x. If this would happen again, say in 2019 and 2020, it would bring palladium to a peak of $5,000 before crashing back to “normal” levels.
It is a possibility, it its not a given. The probability might be low, but this is the type of opportunity investors do not want to miss!
A Palladium Prediction Of $5000 by 2020: Quarterly vs Intraday chart
We will do now something that is highly unusual for our standards and norms. We switch from the longest timeframe to the shortest timeframe just to show how the same price levels apply.
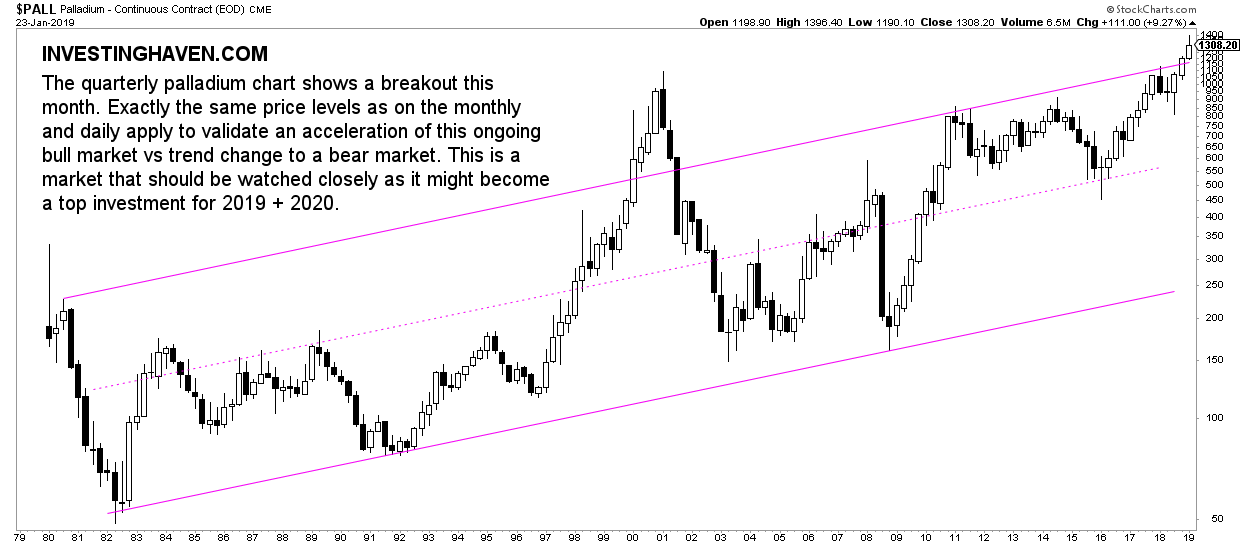
The quarterly palladium chart shows a breakout this month. Exactly the same price levels as on the monthly and daily apply to validate an acceleration of this ongoing bull market vs trend change to a bear market.
Although not exactly the same dollar prices apply there is a clear area in the $1250 to $1300 which marks the breakout level on the longest timeframe.
On the very short term we are looking at how the price evolves in this intersection of the 2 areas outlined in below chart. How palladium behaves at $1300 and $1420 as well as $1440 will be crucial.
[Ed. note: As of this week we will provide in-depth analysis to our ‘free newsletter’ subscribers. We will bring premium content with specific (gold and silver) investing tips on a weekly basis, mid-week, free of charge. We will do this for 4 to 6 months. Subscribe to our free newsletter and get premium (gold and silver) investing insights in 2019 for free. Sign up >> ]


